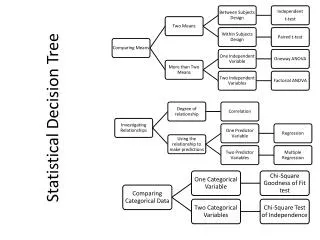
Decision Errors and Statistical Power
Decision Errors and Statistical Power. Overview To understand the different kinds of errors that can be made in a significance testing context To understand the implications of these errors, and how they can be controlled by the researcher

Decision Errors and Statistical Power
E N D
Presentation Transcript
Decision Errors and Statistical Power • Overview • To understand the different kinds of errors that can be made in a significance testing context • To understand the implications of these errors, and how they can be controlled by the researcher • To understand the concept of statistical power and how it can be used to improve the quality of research that employs significance testing
Inferential Errors in NHST Real World Null is true Null is false Correct decision Type II error Null is true Conclusion of the significance test Correct decision Null is false Type I error
Errors in Inference using NHST • Type I error: Erroneously rejecting the null hypothesis. Your result is significant (p < .05), so you reject the null hypothesis, but the null hypothesis is actually true. • Type II error: Erroneously accepting the null hypothesis. Your result is not significant (p > .05), so you don’t reject the null hypothesis, but it is actually false.
How do we control Type I errors? • The Type I error rate is controlled by the researcher. • It is called the alpha rate, and corresponds to the probability cut-off that one uses in a significance test. • By convention, researchers use an alpha rate of .05. In other words, they will only reject the null hypothesis when a statistic is likely to occur 5% of the time or less when the null hypothesis is true. • In principle, any probability value could be chosen for making the accept/reject decision. 5% is used by convention.
Type I errors • What does 5% mean in this context? • It means that we will only make a decision error 5% of the time if the null hypothesis is true. • If the null hypothesis is false, the Type I error rate is undefined.
How do we control Type II errors? • Type II errors can also be controlled by the experimenter. • The Type II error rate is sometimes called beta, as a complement to alpha. • How can the beta rate be controlled? The easiest way to control Type II errors is by increase the statistical power of a test.
Statistical Power • Statistical power is defined as the probability of rejecting the null hypothesis when it is false—a correct decision (1-beta). • Power is strongly influenced by sample size. With a larger N, we are more likely to reject the null hypothesis if it is truly false. • (As N increases, the standard error shrinks. Sampling error becomes less problematic, and true differences are easier to detect.)
Power and correlation Population r = .30 • This graph shows how the power of the significance test for a correlation varies as a function of sample size. • Notice that when N = 80, there is about an 80% chance of correctly rejecting the null hypothesis (beta = .20). • When N = 45, we only have a 50% chance of making the correct decision—a coin toss (beta = .50).
Power and correlation • Power also varies as a function of the size of the correlation. • When the population correlation is large (e.g., .80), it requires fewer subjects to correctly reject the null hypothesis that the population correlation is 0. • When the population correlation is smallish (e.g., .20), it requires a large number of subjects to correctly reject the null hypothesis. • When the population correlation is 0, the probability of rejecting the null is constant at 5% (alpha). Here “power” is technically undefined because the null hypothesis is true. r = .80 r = .60 r = .40 r = .20 r = .00
Low Power Studies • Because correlations in the .2 to .4 range are typically observed in non-experimental research, one would be wise not to trust research based on sample sizes less than 60ish. • Why? Because such research only stands a 50% chance of yielding the correct decision, if the null is false. It would be more efficient (and, importantly, just as accurate) to flip a coin to make the decision rather than collecting data and using a significance test. r = .80 r = .60 r = .40 r = .20 r = .00
A Sad Fact • In 1962 Jacob Cohen surveyed all articles in the Journal of Abnormal and Social Psychology and determined that the typical power of research conducted in this area was 53%. • An even sadder fact: In 1989, Sedlmeier and Gigerenzer surveyed studies in the same journal (now called the Journal of Abnormal Psychology) and found that the power had decreased slightly. • Researchers, unfortunately, pay little attention to power. As a consequence, the Type II error rate of research in psychology is likely to be dangerously high—maybe as high as 50%.
Power in Research Design • Power is important to consider, and should be used to design research projects. • Given an educated guess about what the population parameter might be (e.g., a correlation of .30, a mean difference of .5 SD), one can determine the number of subjects needed for a desired level of power. • Cohen and others recommend that researchers try to obtain a power level of about 80%.
Power in Research Design • Thus, if one used an alpha-level of 5% and collected enough subjects to ensure a power of 80% for an assumed effect, one would know, before the study was done, what the theoretical error rates are for the statistical test. • Although these error rates correspond to long-run outcomes, one could get a sense of whether the research design was a credible one—whether it is likely to minimize the two kinds of errors that are possible in NHST and, correspondingly, maximize the likelihood of making a correct decision.