Download
1 / 37
400 likes | 619 Vues
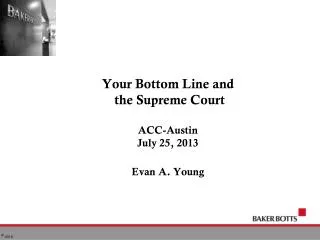
CORRECTED/ UPDATED 04/23/12 FOR 2012 IRC & CTSG WORK to prepare for 2013 ITRS. ORTC 2012/13 ITRS Work IRC and CTSG Plenary. Alan Allan 04/23/2012 Based on [WAS] ORTC Final Rev 1a, 12/13/11 [plus backup].

E N D
CORRECTED/ UPDATED 04/23/12 FOR 2012 IRC & CTSG WORK to prepare for 2013 ITRS ORTC 2012/13 ITRS WorkIRC and CTSG Plenary Alan Allan 04/23/2012 Based on [WAS] ORTC Final Rev 1a, 12/13/11 [plus backup]
2011 Renewal ITRS ORTC Technology Trend Pre-Summary [and including updates for 2012 Proposals and 2013 ITRS Renewal Preparation] • Unchanged for 2010/11: MPU contacted M1 1) 2-year cycle trend through 2013 [27nm (“14nm” node)]; then 3-year trend to 2026 consider for 2013 ITRS proposal: extend 2yr cycle to 2017/14nm (”7nm” node) 2) 60f2 SRAM 6t cell Design Factor Proposal for 2013 ITRS consideration: tbd 3) 175f2 Logic Gate 4t Design Factor Proposal for 2013 ITRS consideration: tbd 4) Ongoing - evaluate alignment of “nodes” with latest M1 industry status and also High Performance/Low Power timing needs 2) Unchanged for 2010/11 Tables:MPU Functions/Chip and Chip Size Models • Design TWG Model for Chip Size and Density Model trends – tied to technology cycle timing trends and cell design factors • ORTC line item OverHead (OH) area model, includes non-active area • Proposal for 2013 ITRS consideration: tbd; based on final consensus of new proposals • Updated for 2010/11 Tables:MPU GLpr, GLph – trends “smoothed” by PIDS modeling; but close to previous targetsProposal for 2013 ITRS consideration: tbd; targeted for 8% CAGR (1/CV/I) intrinsic transistor performance vs. present 2011 ITRS 13% trend • Updated for 2010/11 Tables:VddLow operating and standby line items from PIDS model track “smoothed” gate length changes Proposal for 2013 ITRS consideration: tbd; targeted for 8% CAGR (1/CV/I) intrinsic transistor performance vs. present 13% • Added in 2011 – Table ORTC-6 Battery Energy Storage (Watt-hours) Line Item from iNEMI Roadmap [will update based on 2013 iNEMI roadmap work]
2011 Renewal ITRS ORTC Technology Trend Pre-Summary (cont.) 6) Updated in ORTC 2011 Tables - DRAM contacted M1: • 1-year pull-in of M1 and bits/chip trends; [unchanged] • no Flattening of DRAM M1 as with Flash Poly** [unchanged] • 4f2 push out [to 2013]; 2012 Update: 2014/4f2 • Increased array efficiency from 56% to 59% [unchanged; needs review] 7) Updated in ORTC 2011 Tables - Flash Un-contacted Poly: • 2+-year pull-in of Poly; however slower 4-year cycle (0.5x per 8yrs) trend to 2020/10nm; then 3-year trend to 2022/8nm; then Flat Poly after 2022/8nm; [unchanged] • and 3bits/cell extended to 2018; 4bits/cell delay to 2022 [unchanged] • Updated in ORTC 2011 Tables - DRAM Bits/Chip and Chip Size Model: • 3-year generation “Moore’s Law” bits/chip doubling cycle target (1-2yr delay for smaller chip sizes <30mm2 – 2x/2.5yrs) [unchanged] • Updated in ORTC 2011 Tables - Flash Bits/Chip and Chip Size Model: • 3-year generation “Moore’s Law” bits/chip doubling cycle target (after 1-yr acceleration; then flat @ 1-2Tbits; keep chip size <160mm2); [unchanged] • New 3D layers Models vs. relaxed half-pitch tradeoffs are now included in the 2011 Renewal for maximum bits per chip [2012 Update Survey Proposal:2016 increased from 8/32nm -128/18nm Layers to 16/48nm – 128/24nm Layers (option C in 2011 ORTC Table 2)]
2011 Renewal ITRS ORTC Technology Trend Pre-Summary (cont.) 10) Updated in ORTC 2011 Tables - ORTC Table 5 - Litho # of Mask Counts MPU, DRAM, 1) Flash Survey inputs Updated • Also IC Knowledge (ICK) model contribution to extend mask levels range • Proposal for 2013 ITRS consideration: tbd; based on survey plus modeling consensus of Litho, PIDS, FEP, Design 11) Unchanged for 2011[and 2012 Update] - IRC 450mm Position: • Timing Status (as of July, 2011 – to be updated by G450C in July, 2012) • Consortia work underway • IDM and Foundry Pilot lines: 2013-14; • Production: 2015-16 • SEMATECH/ISMI making good progress on 450mm program activities to meet the ITRS Timing 1) Consortium operations are using 450mm early test wafer process, metrology and patterning capability to support Supplier development • 193 immersion multiple exposure litho tools are under development to support consortium and manufacturers’ schedules [for stated “1xnm technology” goal; note: 19nm-10nm M1 = “10nm-5nm” “nodes”= 2015-2022 (ITRS) – see Inchon Litho public presentation] • 450mm increasing silicon demand is needed from consortium demonstrations to support development 3) Europe momentum building - EEMI status reviewed with IRC in Potsdam [update due at Netherlands IRC meetings Apr’12] 4) FI TWG extended 300mm wafer generation in parallel line item header with 450mm; • Including Technology upgrade assumptions through end of roadmap • Assuming compatibility of 300mm productivity extensions into the 450mm generation; • Utilizing a new ITRS-based ICK Strategic commercial model , SEMATECH has developed 300mm and 450mm 2009-2024 Range Scenarios for silicon and equipment demand ; ICK has updated to 2011 ITRS www.itrs.net 12) Updated in 2011 - More than Moore white paper online at www.itrs.net • New “Moore’s Law and More” Graphic update included in 2011 ITRS Executive Summary • MtM Workshop completed in Potsdam, GE, in April and reviewed at Summer ITRS meeting • New MEMS TWG and Chapter added to 2011 ITRS • Proposals for 2013 ITRS consideration:tbd; ITRS MtM cross-TWG work; plus Weds, 4/25 Europe workshop includes new iNEMI applications driver presentation (Grace O’Malley/Europe iNEMI Mgr. – highlights on Automotive; Medical; Energy; Lighting; et al) )
2011 Renewal ITRS ORTC Technology Trend Summary (cont.) Technology Pacing Cross-TWG Study Group (CTSG) work preparation for 2012 Update [move to 2013 ITRS Renewal (kickoff Dec’12) including new cooperation with PIDS, M&S, and the NIST, ST (MASTAR), and Purdue (TCAD) modeling teams]: • IRC Equivalent Scaling Graphic Update • Included in 2011 Update: Parallel bulk and SOI pathways; and Clarification of gate mobility materials pathway • Proposals for pull-in placement of MuGFET [2012 Update work] [preparation for 2013 ITRS] and III/V Ge Timing [consider in 2013 ITRS work] (one IDM or Foundry company may lead technology production ramp) • PIDS and FEP Memory Survey Proposal Updates • Additional acceleration will be monitored [see 2012 ITRS Update Proposals] • FEP and Design and System Drivers Logic Monitor • Monitor MPU and Leading Edge Logic technology trends [2012 Proposals for 2013 ITRS] • A&P/Design Power (Thermal) Model [2012 proposals for 2013 ITRS] • Possible proposals for Power Dissipation "hot spot" model rather than chip area basis • PIDS/Design Max On-chip Frequency vs Intrinsic Modeling • Included in 2011 Update: New Max Chip Frequency trends (reset to 3.6Ghz/2010 plus 4% CAGR trend) • TBD PIDS Intrinsic Transistor and Ring Oscillator model Changes to 8% [from unchanged 2011 13% trend (supported past 8% Design Frequency trend)] • PIDS Updates include MASTAR static modeling near-term and TCAD dynamic long-term modeling • Also “equivalent scaling” tradeoffs (FDSOI, MuGFET, III-V/Ge) with dimensional scaling; timing to include IRC proposal for “Leading Co.” driver timing • YE Defect Density Modeling • New ORTC Defect Density model work moved to 2012 Update due to loss of modeling resources [2012 proposals for 2013 ITRS]
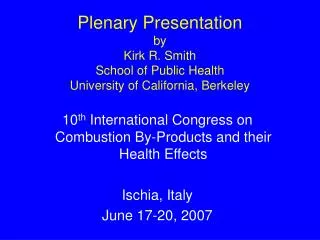
More than Moore: Diversification Analog/RF Passives HV Power Sensors Actuators [e.g. MEMS] Biochips Interacting with people and environment Non-digital content System-in-package (SiP) 130nm 90nm Baseline CMOS: CPU, Memory, Logic 65nm Information Processing Digital content System-on-chip (SoC) Combining SoC and SiP: Higher Value Systems More Moore: Miniaturization 45nm 32nm 22nm 16 nm . . . V Beyond CMOS Figure 4 The Concept of Moore’s Law and More Source: 2011 ITRS - Exec. Summary Fig. 4
DRAM ½ Pitch = DRAM Metal Pitch/2 FLASH Poly Silicon ½ Pitch = Flash Poly Pitch/2 MPU/ASIC M1 ½ Pitch = MPU/ASIC M1 Pitch/2 • Metal • Pitch 32-64 Lines Typical flash Un-contacted Poly Typical DRAM/MPU/ASIC Metal Bit Line Exec. Summary - Figure 1 Definition of Half-Pitch More Poly Dense Lines added in 2010 ITRS Update [Note: The ITRS does not utilize any single-product “node” designation reference; Flash Poly and DRAM M1 half-pitch are still Lithography drivers; however, other product technology trends may be drivers on individual TWG tables] • Poly • Pitch Source: 2011 ITRS - Exec. Summary Fig. 1
200K Development Production Volume (Wafers/Month) 20K 2K Alpha Tool Beta Tool Production Tool 200 Proposal: First 1-2 Companies Reaching Combined Production (work in Progress) 20 First Conf. Papers 2 Additional Lead-time: ERD/ERM Research and PIDS Transfer 0 12 24 -24 -12 Months Figure 2a - (within an established wafer generation*) - *see also Figure 2a for ERD/ERM Research and PIDS Transfer timing; and also - Figure 6 (450mm topic) for Typical Wafer Generation Pilot and Production “Ramp Curves” Production Ramp-up Model and Technology/Cycle Timing Proposal * For 2012 Update Note: Fewer leading IDM Companies Requires Adaption of Definition To allow one IDM Company Or a Foundry Representing Many Fabless Companies To Lead a Technology Production Ramp Timing *Proposal Note: Leadership company First Manu- facturing could set more aggressive first production target, since “fast followers” may trail 1-3 years Source: 2009 ITRS - Exec. Summary Fig. 2a Work in Progress - Do Not Publish
Figure 2b A Typical Technology Production “Ramp” Curve for ERD/ERM Research and PIDS Transfer timing - including an example for III/V Hi-Mobility Channel Technology Timing Scenario - Acceleration to 2015 Scenario for the 2012 Update work 200K 20K 2K 200 20 First Tech. Conf. Device Papers Up to ~12yrs Prior to Product 2 0 24 -96 -72 -24 -48 Hi-m Channel Example: 2011 2013 2015 2017 2019 2021 Production Research Development ITRS Near Term (2011 – 2019) ITRS Long Term (2019 – 2025) Transfer to PIDS/FEP (96-72mo Leadtime) Alpha Tool Beta Tool Product Tool Volume (Wafers/Month) 1st 2 Co’s Reach Product First Tech. Conf. Circuits Papers Up to ~ 5yrs Prior to Product Hi-m Channel Proposal - for 2013 ITRS work Months Source: 2011 ITRS - Exec. Summary Fig. 2b; plus: [http://www.eetimes.com/electronics-news/4087596/Intel-s-Gargini-pushes-III-V-on-silicon-as-2015-transistor-option ]
[Backup] 2011 ITRS hi-perf GLpr : 54nm 47nm 47nm 41nm 35nm 31nm 28nm 20nm 14nm 2011 ITRS hi-perf GLph : 32nm 29nm 29nm 27nm 24nm 22nm 20nm 15nm 12nm Increasing 450mm Silicon Demand From Demonstrations 2009 ITWG Table Timing: 2007 2010 2013 2016 2019 68nm 45nm 32nm 22nm 54nm 16nm 45nm 32nm 22nm 15nm 2011 IS ITRS DRAM M1 : 11nm 2011 IS ITRS Flash Poly : MPU/hpASIC “Node”: “45nm” “32nm/28” “22/20nm” “16/14nm” “11/10nm” “8/7nm” 2011 ITRS MPU/hpASIC M1 : 76nm 65nm 54nm 45nm 38nm 32nm 27nm 19nm 13nm 450mm Production Ramp-up Model 2012 ITRS Proposal [ Modified from 2009 ITRS Figure 2c A Typical Wafer Generation Pilot Line and Production “Ramp” Curve ] Versus “Node” vs. actual contacted M1 and un-contacted Poly Half-Pitch alignment 2012 ITRS 450mm Production Ramp-up Model [Modified from 2009 Figure 2c A Typical Wafer Generation Pilot Line and Production “Ramp” Curve ] [ 7/27 Note for 450mm Special Topic: Need Consortium Development and Demonstration Update and Silicon Consumption model in light of latest Consortium plans… ] Demonstration Development Production <--------------------- Consortium -------------------------- Manufacturing Demonstrations focus on 1xnm M1 half-pitch capable tools Alpha Tool Beta Tool Silicon is supporting development using partially-patterned and processed test wafers --IDM & Foundry - Pilot Lines Volume Proposal for consideration in 2012 ITRS Update work for Proposals for 2013 ITRS Kickoff Hsinchu Dec, 2012: continue to extend M1:on 2-yr Cycle through 2017/13nm (“8/7nm” “node”)? “1x nm” Beta Tool Production Tool 2010 2011 2012 2015 2016 20 13 20 14 Years Source: Proposal 2011 ITRS - Executive Summary Fig tbd 2012 MPU = DRAM 22-24 8nm 2024 8nm 2021 11.3nm *Note: At ITRS/USA, the IRC recommended updating the ITRS 450mm Timing Graphic for use in the 2011 ITRS Roadmap guidance; based on guidance from SEMATECH suggestions for modification and commentary in an Executive Summary Topic. 2013/14 MPU < DRAM 2015 on M1: 2-yr Cycle? 2017 on M1: 2-yr Cycle? Work in Progress - Do Not Publish
2011 ORTC Table 1 [Unchanged for 2012 Update; tbd 2013 ITRS Renewal] Near-term Years 450mm Production Target : 2015-2016 ‘11 ITRS EUV Intro: DRAM&Flash: 2013 MPU: 2015 Long-term Years ? ? Work in Progress - Do Not Publish 2-year “Node” Cycle (@ 0.7071/2yrs = 0.8409/yr 2011 ITWG Table Timing: 2007 2010 2013 2016 2019 2021 2023 2025 MPU/hpASIC “Node”(nm): “45” “38” “32” “27” “22.5” “19” “16” “13.4” “11.25” “9.5” “8.0” “6.7” “5.6” “4.73” “4.0” “3.34” “2.81” “2.37” “2.0” 2011 ITRS M1 2yr cyc(nm): 76 65 54 45 38 32 27 22.5 19 16 13.4 11.25 9.5 8.0 6.7 5.6 4.73 4.0 3.34 2011 ITRS M1 3yr cyc (nm): 76 65 54 45 38 32 26.8 23.8 21.2 18.9 16 .9 15.0 13.4 11.9 10.6 9.5 8.43 7.5 6.69
2011 ITRS Figure 11 – ORTC Table 1 Graphical Trends – Memory Half Pitch [With 2011 Flash 3D Scenario Overlay] UNCHANGED However, FOR 2012 CTSG WORK: DRAM 4f2/’14; 3D Flash 2016/’16 Layers @ 48nm – op. C ? PIDS 3D Flash : Looser Poly half-pitch 2016-18/32; Then 2019-21/28nm Then 2022-25/24nm Then 2025-26/18nm ~5.5-yr Cycle 3D -16layers/48nm? 4-yr cycle? 3D -256layers/24nm? 3D - 8 layers 3D - 128 layers 5.5-yr cycle 16nm Source: 2011 ITRS - Executive Summary Fig 3 Long-Term ’19-’26
2011 ITRS Figure 4 – ORTC Table 1 Graphical Trends – Logic (MPU and high-performance ASIC) Half Pitch and Gate Length UNCHANGED FOR 2012 CTSG WORK; but Proposals to be Considered 16nm Long-Term ’19-’26 Source: 2011 ITRS - Executive Summary Fig 4
2011 ITRS Figure 4 – ORTC Table 1 Graphical Trends – Logic (MPU and high-performance ASIC) Half Pitch and Gate Length [MPU vs. Memory] UNCHANGED FOR 2012 CTSG WORK; but Proposals to be Considered Flash Trends DRAM Trends 16nm Long-Term ’19-’26 Source: 2011 ITRS - Executive Summary Fig 4
2011 ITRS Figure 4 – ORTC Table 1 Graphical Trends – Logic (MPU and high-performance ASIC) Half Pitch and Gate Length 2012 ITRS Work:“22nm” (ITRS 2011 Planar M1=38nm ; GL=24nm) MugFET M1=??nm; 3D Physical Gate Length = ??nm? 2012 ITRS Work Consider: “7nm” pull-in to 2017 (ITRS 2011 Planar M1=14nm); 2019 ITRS GLph = 11.7nm unchanged; except for MugFET M1=??nm; 3D and FDSOI Physical Gate Length = ??nm? Logic and Flash (3yr cycle) both drive Lithography after 2017; Logic M1 after 2022? Flash Trends DRAM Trends ? 16nm FDSOI MuG-FET 2-year M1 pace extension to 2017 ; then 3yrs again Long-Term ’19-’26 Source: 2011 ITRS - Executive Summary Fig 4
Metal High k 2nd generation nth generation D S High-µ InGaAs; Ge Si + Stress 2011 ITRS hi-perf GLpr : 54nm 47nm 47nm 41nm 35nm 31nm 28nm 20nm 14nm 2011 ITRS hi-perf GLph : 32nm 29nm 29nm 27nm 24nm 22nm 20nm 15nm 12nm PDSOI FDSOI 2011 ITWG Table Timing: 2007 2010 2013 2016 2019 2021 54nm 45nm 32nm 11nm 2011 ITRS Flash Poly : 68nm 45nm 32nm 22nm 16nm 2011 ITRS DRAM M1 : MPU/hpASIC “Node”: “45nm” “32nm” “22/20nm” “16/14nm” “11/10nm” “8/7nm” 2011 ITRS MPU/hpASIC M1 : 76nm 65nm 54nm 45nm 38nm 32nm 27nm 19nm 13nm 2011 ITRS Figure 5 “Equivalent Scaling” Roadmap for Logic (MPU and high performance ASIC) Figure 5 ORTC Table 1 Graphical Trends (including overlay of 2009 industry logic “nodes” and ITRS trends for comparison); also including proposals for MugFET and III/V Ge acceleration for 2012 ITRS Update work [ PIDS/FEP/Design HP/LOP/LSTP Sub-Team Transistor Modeling Work Underway ] 450mm 1st Production Metal Metal With 2012 ITRS IRC Guidance Update Proposal Note*: Gate-stack material High k High k Channel material *Proposal Note: Leadership company First Manu- facturing could set more Aggressive first production target, since “fast followers” may trail 1-3 years Proposals - for 2013 ITRS preparation D S Possible Pull -in Multi-gate (on bulk or SOI) Structure (electrostatic control) Bulk Possible Delay 22-24 8nm 15nm 22nm 2009 2012 2015 2018 2021 11nm 2024 8nm 17 Source: 2011 ITRS - Executive Summary Fig 5
UPDATED 04/19/12 FOR Design Discussion Prep for Europe 2012 CTSG WORK And 2013 ITRS Preparation Metal High k 2nd generation nth generation D S High-µ InGaAs; Ge Si + Stress 2011 ITRS hi-perf GLpr : 54nm 47nm 47nm 41nm 35nm 31nm 28nm 20nm 14nm 2011 ITRS hi-perf GLph : 32nm 29nm 29nm 27nm 24nm 22nm 20nm 15nm 12nm PDSOI FDSOI 2011 ITWG Table Timing: 2007 2010 2013 2016 2019 2021 54nm 45nm 32nm 11nm 2011 ITRS Flash Poly : 68nm 45nm 32nm 22nm 16nm 2011 ITRS DRAM M1 : MPU/hpASIC “Node”: “45nm” “32nm” “22/20nm” “16nm/14nm” “11/10nm” “8/7nm” 2011 ITRS MPU/hpASIC M1 : 76nm 65nm 54nm 45nm 38nm 32nm 27nm 19nm 13nm 2011 ITRS Figure 5 “Equivalent Scaling” Roadmap for Logic (MPU and high performance ASIC) Figure 5 ORTC Table 1 Graphical Trends (including overlay of 2009 industry logic “nodes” and ITRS trends for comparison); also including proposals for MugFET and III/V Ge acceleration for 2012 ITRS Update work Metal Metal Gate-stack material High k High k Proposal - for 2013 ITRS prep. *Proposal Note: Leadership company First Manu- facturing could set more Aggressive first production target, since “fast followers” may trail 1-3 years Channel material http://semimd.com/blog/2012/03/15/ibm-staying-on-soi-technology-for-14nm-finfets/ “…IBM will move to finFETs based on silicon-on-insulator wafers at the 14 nm node….” “…You don’t need well contacts. And anyone who does a cost analysis will conclude that the cost of isolation in bulk is comparable to the cost of the SOI wafer…” “…IBM has developed an embedded DRAM technology on its current SOI platform, he said carrying eDRAM forward to vertical transistors will be relatively straightforward…” “…The Fishkill Alliance of companies, including Samsung, GlobalFoundries, Toshiba, and others, will pursue bulk finFETs at the 14nm node…” Proposals - for 2013 ITRS preparation D S Possible Pull -in Multiple companies with Bulk MugFET pull-in to “14nm”/2014? Multi-gate (on bulk or SOI) Structure (electrostatic control) Bulk Possible Delay FDSOI MugFET pull-in to “14nm”/2014? 22-24 8nm 15nm 22nm 2009 2012 2015 2018 2021 2012 MPU = DRAM 11nm 2024 8nm 2015 on M1 2-yr Cycle? 18 2013-14 MPU < DRAM 2017 on M1 2-yr Cycle? Source: 2011 ITRS - Executive Summary Fig 5 2-year “Node” Cycle (@ 0.7071/2yrs = 0.8409/yr 2011 ITWG Table Timing: 2007 2010 2013 2016 2019 2021 2023 2025 ? ? MPU/hpASIC “Node”(nm): “45” “38” “32” “27” “22.5” “19” “16” “13.4” “11.25” “9.5” “8.0” “6.7” “5.6” “4.73” “4.0” “3.34” “2.81” “2.37” “2.0” 2011 ITRS M1 2yr cyc(nm): 76 65 54 45 38 32 27 22.5 19 16 13.4 11.25 9.5 8.0 6.7 5.6 4.73 4.0 3.34 2011 ITRS M1 3yr cyc (nm): 76 65 54 45 38 32 26.8 23.8 21.2 18.9 16 .9 15.0 13.4 11.9 10.6 9.5 8.43 7.5 6.69
2011 ITRS Figure 4 – ORTC Table 1 Graphical Trends – Logic (MPU and high-performance ASIC) Half Pitch and Gate Length 1995->2015 “Nodes” “360-11(10)” ITRS M1 hp 303-21nm ITRS GLph ‘95-’99-’03-’15 360nm-90nm 90nm-45nm 45nm-17nm 2009/2010 ITRS Unchanged (except extend to new end period): 2011 ITRS: 2011-2026; also includes 2012 Update “Equivalent Scaling” Proposals 2012 ITRS Work:“22nm” (ITRS 2011 Planar M1=38nm ; GL=24nm) MugFET M1=??nm; 3D Physical Gate Length = ??nm? Half-Pitch + “Design Factors” Xf2 = “Moore’s Law” ITRS 1999 P. Gargini “EquivalentScaling” Concept ERD/ERM : What is Next? Optical interconnect? Carbon NanoTubes/Graphene?; MRAM?; Quantum Dots Memory? Equiv. Scaling Gate Length Trade-off Half-Pitch + “Design Factor” Scaling [6t SRAM = 60f2; 4t Logic = 175f2] Enables “Moore’s Law” Functions/ chip Strain ? 450mm 2015-16 MPU: EUV Intro. 2015 16nm HK/MG MugFET from 2015 -> 2011; Proposal for 2012 ITRS Work for 2013 ITRS prep. PDSOI FDSOI 2011 ITRS: Extend M1; & GLpr; to 2026 on 3-year Cycle MuG-FET Gate Length + “Equivalent Scaling” = Power & Performance Updated “Equivalent Scaling” Proposal - for 2012 work Also III/V; Ge from 2019 -> 2015? Proposal for 2013 ITRS Preparation Work GLph versus M1 in 2026 - analyzing implications Hi-u,(tbd) 2-year M1 pace extension to 2017 ; then 3yrs again Multiple companies with Bulk MugFET pull-in to “14nm”/2014? FDSOI MugFET pull-in to “14nm”/2014? Long-Term ’19-’26 Source: 2011 ITRS - Executive Summary Fig 4 2-year “Node” Cycle (@ 0.7071/2yrs = 0.8409/yr UPDATED 04/19/12 FOR Design Discussion Prep for Europe 2012 CTSG WORK And 2013 ITRS Preparation 2011 ITWG Table Timing: 2007 2010 2013 2016 2019 2021 2023 2025 ? ? MPU/hpASIC “Node”(nm): “45” “38” “32” “27” “22.5” “19” “16” “13.4” “11.25” “9.5” “8.0” “6.7” “5.6” “4.73” “4.0” “3.34” “2.81” “2.37” “2.0” 2011 ITRS M1 2yr cyc(nm): 76 65 54 45 38 32 27 22.5 19 16 13.4 11.25 9.5 8.0 6.7 5.6 4.73 4.0 3.34 2011 ITRS M1 3yr cyc (nm): 76 65 54 45 38 32 26.8 23.8 21.2 18.9 16 .9 15.0 13.4 11.9 10.6 9.5 8.43 7.5 6.69
2011 ORTC Figure 6 Product* Function Size Trends; plus PIDS NAND Flash Multi-Layer 3D Model Plus “Slower” Dimensional Reduction Rate Trend Tradeoff Updated 04/23/12 FOR 2012 CTSG WORK [transistor + capacitor] MPU/ASIC Alignment Design TWG Actual SRAM [60f2] & Logic Gate [175f2] DRAM 4f2 Added WAS:Begin in 2011 IS: Delayed To 2013 ‘14 Flash Impact of: 3D - 8 layers 5.5-yr cycle Flash [4f2] 1) 2-yr Cycle Extended to 2010; 2) 3 bits/cell added 2009-2011[and extended to 2026 in the 2011 ITRS]; 3) 4 bits/cell moved from 2012 [to 2021 in the 2011 ITRS] 3D - 128 layers Vs: 3D -16layers/48nm? 2011 ITRS: 2011-2026 4-yr cycle? 3D -256layers/24nm? Source: 2011 ITRS - Executive Summary Fig 6 Long-Term ’19-’26
Figure 7 2011 ITRS Product Technology Trends: Memory Product Functions/Chip and Industry Average “Moore’s Law” and Chip Size Trends 4Tbits Possible with PIDS NAND Flash Multi-Layer 3D Model Scenario Option 2011 3D - 128 layers/ ‘25 2025/32nm/3bits/cell 4Tbits =128x33Gbits 2025/18nm/3bits/cell 13Tbits =128x99Gbits DRAM 4f2 Added WAS:Begin in 2013 IS: Delayed To 2013 ‘14 2011 ITRS: 2011-2026 Source: 2011 ITRS - Executive Summary Fig 7 Long-Term ’19-’26
Average "Moore's Law" = 2x/2yrs “22nm”/(38nm M1) MPU Model Generations Figure 8 2011 ITRS Product Technology Trends: MPU Product Functions/Chip and Industry Average “Moore’s Law” and Chip Size Trends [unchanged from 2009, except extended to 2026] MPU = 2x/3yrs 2012 Unchanged - Must evaluate Impact of 04/23/12 Proposals FOR 2012 IRC & CTSG Consensus Work for 2013 ITRS Consideration MPU = 2x/2yrs MPU/hpASIC M1 Technology Cycle and MPU Transistors/chip are On 3-year Cycle after 2013 vs. Average 2-year Historical Moore’s Law <260mm2 <140mm2 2011 ITRS: Unchanged, but Extend ed Transistors/chip & Chip Size Models to 2026 On 3-year Cycle 2011 ITRS: 2011-2026 Source: 2011 ITRS - Executive Summary Fig 8 Long-Term ’19-’26
Backup for IRC and ITWG Plenary • (23-26) Litho Mask Count (3 Foils) • (27-29) 4% Design/PIDS Frequency vs. PIDS 8% 1/(CV/I) Proposal • (30) MOS Transistor Scaling and Scaling Calculator • (31) SICAS Capacity analysis update • (32,33) DRAM Functions/Chip 2009 ITRS vs. 2011 ITRS (2 foils) • (34) Planar Transistor Diagram • (35) Interconnect with Flash M1 Diagram • (36) 2008 Consortium FinFET IEDM Paper Analysis • (37) Wikipedia Tri-Gate references
ORTC Table 5 Update: Litho TWG model for Mask Count • MPU survey-based, mask counts peak 2014/(54 masks peak) EUV expected 2015 • DRAM referenced to MPU, mask counts peak 2012/(41 masks peak) EUV expected 2013 • Flash survey-based, mask counts peak 2012/(43 masks peak) EUV expected 2013 • Sidewall image transfer technology IEDM papers should be evaluated • Table 5 also includes NEW IC Knowledge (ICK) www.icknowledge.com modeled comparison targeting ITRS 2011 Litho EUV timing; but extended out through 2024 using 2009-10 ITRS (www.itrs.net ) assumptions • Limited YE Defect Density modeling resources requires delay of update response to 2012 ITRS Update work
Fig 7a - Litho 2011 Survey vs ICK 2011 ITRS-based* Model[*extended to 2024 based on 2009-24 ITRS www.itrs.net] ICK ITRS-based v2001 MPU 300mm/”32nm Node” 59-54nm M1 2008-09 51-52 Masks SEMATECH Survey EUV timing: MPU in 2015; DRAM & Flash in 2013 450mm 2015-2016 Litho Mask Count by Product Category Actual < - > Forecast Source: 2011 ITRS - Executive Summary Fig. 7a
MPU Delay EUV to 2017 Fig. 7b - Litho 2011 Survey vs ICK 2011 ITRS-based* Model (cont.)[*extended to 2024 based on 2009-24 ITRS www.itrs.net] Flash Charge Trap in 2012; Multi-layer 3D begins 2016 ICK Strategic Model* 450mm 2015-2016 ICK ITRS-based v2001 MPU 300mm/”32nm Node” 59-54nm M1 2008-09 51-52 Masks *Based on ITRS 2009-10 editions EUV timing: MPU in 2015; DRAM & Flash EUV in 2013 Litho Mask Count by Product Category Actual < - > Forecast Source: 2011 ITRS - Executive Summary Fig. 7b
Table FreqTopic tbd - 2011 Chip Frequency Model Trend vs.2009/2010 ITRS Frequency Ghz ORTC Table 4: Design TWG Model for On-Chip Frequency • Lower model starting point 2010/3.6Ghz • 4% growth rate through 2026 • *Unchanged 2011 ITRS 13% PIDS target model Intrinsic Transistor Frequency Growth; • *However, proposal for 2012 ITRS 8% PIDS target model Intrinsic Transistor Growth (work preparation in 2011) Source: 2011 ITRS - Executive Summary Table tbd
Fig 8a - PIDS 2009/11 ITRS CV/I Trends vs. 2012 ITRS MUG-FET 4-year Pull-In and Lower Intrinsic Freq. Trend Proposals PIDS 2011 ITRS Table: 1/(CV/I) (Ghz) = ‘11/156 – ‘26/1000 @ ~ 13% CAGR ‘11/ 313 – ’26/686 @ 5.4% CAGR – MugFET Trend [2012 Proposal: MugFET 4-year Leading Co. pull-in] PIDS 2011 ITRS Table: CV/I) (ps) = ‘11/0.64 – ‘26/0.10 @ ~ -12% CAGR ‘11/ 0.319 – ’26/0.146 @ - 4.8% CAGR – MugFET Trend [2012 Proposal: MugFET 4-year Leading Co. pull-in] 1/(CV/I) (Ghz) ~ ~ 13% CAGR PIDS 2012 FDSOI Scenario: ‘15/294 – ’26/686 @8.0% CAGR PIDS Table 2: CV/I – 2009-2011 ITRS Unchanged 1/(CV/I )(Ghz) Note: 1/(CV/I) frequency is reduced by a factor of 1/22.4 in a PIDS model of a Ring Oscillator (inverter chain) 101 stages; 1001 stages, etc.; FO 1 (capacitance example .1pf); FO 4 (capacitance example .4pf) CV/I (ps) ~ ~ -12% CAGR PIDS 2012 FDSOI Scenario: ‘15/0.340 - ’26/0.146 -7.4% CAGR Year of Production Ramp 2011 ITRS 2011 - 2026 CV/I (ps) Note: 1/(CV/I) frequency is reduced by a factor of 1/22.4 in a PIDS model of a Ring Oscillator (inverter chain) 101 stages; 1001 stages, etc.; FO 1 (capacitance example .1pf); FO 4 (capacitance example .4pf) Year of Production Ramp Figure 8a 2012 Update Model Trend versus 2009/2011 ITRS PIDS TWG Transistor Intrinsic Frequency (1/(CV/I)) Performance Trends Source: 2011 ITRS - Executive Summary Fig. 8a
Fig. 8b - ORTC Table 4:On Chip Local Clock Frequency Trend Comparisons to PIDS vs. 2012 ITRS MUG-FET 4-year Pull-In and Lower Intrinsic Freq. Trend Proposals 2009/11 PIDS/FEP Ring Oscillator Model 101 invertor stages With equivalent Fan-out 4 Capacitance load; Results in Frequency of ~ 1/22 x 1/(CV/I) at ~13% CAGR 2009/11 ITRS PIDS/FEP Intrinsic Transistor Frequency 1/(CV/I) at 13% CAGR 1Thz 2012 Update Scenario: MugFET : 4yr Pull-in 1/(CV/I) to 2011; then 5% CAGR 2012 Update Scenario – FDSOI: Beginning 2015 at 8% CAGR ~ 1/22 2012 Update Scenario: FDSOI at 8% CAGR 2012 Update Scenario: MugFET at 5% CAGR DesignH’room Co.A Actual 2011 ITRS 2011 - 2026 Co.B Actual Co.C Actual • On-Chip Clock Frequency: • Performance Improvement tradeoffs • between dimensional EOT and Gate Length • with “Equivalent Scaling,” both process-related • (ie Strain, FDSOI, MugFET, III/V Ge, etc); • and also Including design-related tradeoffs: • Multi-Core Architecture • Memory Architecture • Software Power Management • etc.] ORTC Table 4: On-Chip Local Clock Frequency: 2011 Design TWG trend: at 4% CAGR 2007 Des TWG Actual History of Average On-Chip 1999 - 2007 1Ghz – 4.9Ghz ~22% CAGR Source: ITRS Test TWG compilation, ca 4Q 2010; 2011 ITRS PIDS, Design TWGs Figure 8b Design On-Chip Frequency vs. PIDS Intrinsic Transistor and Ring Oscillator Model Frequency Source: 2011 ITRS - Executive Summary Fig 8b
Figure 10 MOS Transistor Scaling—1974 to present Figure 11 Scaling Calculator Source: 2011 ITRS - Executive Summary ORTC Fig 1, 2 Work in Progress - Do Not Publish
= 2003/04 ITRS DRAM Contacted M1 Half-Pitch Actual = 2007/09/11 ITRS DRAM Contacted M1 Half-Pitch Target = 2009/11 ITRS Flash Un-contacted Poly Half Pitch Target = 2009/11 ITRS MPU/hpASIC Contacted M1 Half-Pitch Target 2.5-Year DRAM Cycle ; 2-year Cycle Flash and MPU 2010 2013 Technology Cycle Timing Compared to Actual Wafer Production Technology Capacity Distribution >0.7mm 0.7-0.4mm 0.4-0.3mm 0.3- 0.2mm 0.4-0.2mm Feature Size (Half Pitch) (mm) 0.2- 0.16mm 0.16-0.12mm 0.2- 0.12mm 0.12-0.08mm 0.08-0.06mm <0.06mm 2-Year DRAM Cycle 4-Year Cycle for Flash after 2010 Flash pull-in; MPU 3-yr cycle after 2013 3-yr cycle for DRAM after pull-in 3-Year Cycle 2020 1998 Year 2015 * Note: The wafer production capacity data are plotted from the SICAS* 4Q data for each year, except 1Q data for 2011. The width of each of the production capacity bars corresponds to the MOS IC production start silicon area for that range of the feature size (y-axis). Data are based upon capacity if fully utilized. Source: 2011 ITRS - Exec. Summary Fig. 3 *Note: The data for the graphical analysis were supplied by the Semiconductor Industry Association (SIA) from their Semiconductor Industry Capacity Statistics (SICAS). The SICAS data is collected from worldwide semiconductor manufacturers (estimated >90% of Total MOS Capacity) and published by the Semiconductor Industry Association (SIA), as of 1Q11. The detailed data are available to the public online at the SIA website, www.sia-online.org, and data is located at http://www.sia-online.org/industry-statistics/semiconductor-capacity-utilization-sicas-reports/
Contacted M1 Half-Pitch vs. 0.5 x “Transistor or Gate Pitch?” 2012 ITRS Definition Work – Need Clarification of the M1 Half Pitch To clarify the ORTC Table 1 relationship to Gate Length* And for consistency with Interconnect TWG Transistor M1 contacted half-pitch [and public - sometimes presented (IEDM, etc) as “Transistor Pitch” or “Gate Pitch”] ; *vs. Printed Gate Length (GLpr) (sometimes also known as “CD” or Critical Dimension); and finally the publically-measurable Physical Gate Length, (GLph) [Note: The ITRS does not utilize any single-product “node” designation reference; Flash Poly and DRAM M1 half-pitch are still litho drivers; however, other product technology trends may be drivers on individual TWG tables] [>M1 h-p?] [GLpr] Contact Width [GLph] Metal 1 Pitch [Interconnect TWG Example; Dec’10 = 2x M1 Half-Pitch] Metal 1 half-pitch = 0.5 x M1 Pitch] Other ITRS MPU Model Consideration: [SRAM (6-transistor) Cell Area = 60f2 = 60 x (M1 h-p)^2] 32 nm”/56.25nm h-p, 0.171 um2 [= 62.0 x 0.05625^2] [IDF 2009] Work in Progress - Do Not Publish
Wire Wire Wire Metal 3 Via Via Via Metal 2 Metal 1 Metal 0 Poly Pitch Metal 1 Pitch Metal 1 Pitch Metal 1 Pitch 2011 Interconnect TWG - Hierarchical Cross Sections Passivation Dielectric Etch Stop Layer Global (=IMx1.5~2µm) Dielectric Capping Layer Global (=IMx1.5~2µm) Copper Conductor with Barrier / Nucleation Layer Semi- Global (=M1x2) Inter- Mediate (=M1x1) Inter- Mediate (=M1x1) Tungsten Contact Plug Metal 1 Metal 1 Pre-Metal Dielectric Flash Cross-Section ASIC Cross-Section MPU Cross-Section • MPU: Revised hierarchy • ASIC: No drastic change, however semi-global should be kept at 2 x M1 • Flash: The new technology driver for M1
Source : http://www.eetasia.com/ART_8800557135_480100_NT_77e3414c.HTM : “…announced Dec. 16 at the 2008 International Electron Devices Meeting [IEDM] in San Francisco, California…” I. Researchers from the three companies [AMD, IBM, Toshiba] fabricated a highly scaled FinFET SRAM cell using HKMG. 1) It is the smallest non-planar-FET SRAM cell yet achieved: At 0.128µm², a. the integrated cell is more than 50 percent smaller than the 0.274µm² non-planar-FET cell previously reported. b. To achieve this goal, the team optimized the processes, especially for depositing and removing materials, c. including HKMG from vertical surfaces of the non-planar FinFET structure. II. The researchers also investigated the stochastic variation of FinFET properties within the highly scaled SRAM cells and simulated SRAM cell variations at an even smaller cell size. 2) They verified that FinFETs without channel doping improved transistor characteristic variability by more than 28 percent. a. In simulations of SRAM cells of 0.063µm² area, equivalent to or beyond the cell scaling for the 22nm node, b. the results confirmed that the FinFET SRAM cell is expected to offer a significant advantage in stable operation c. compared with a planar-FET SRAM cell at this generation 2008 IEDM: 110nm Pitch 55nm Half-Pitch “32 nm”/55nm h-p, 0.128 um2 [= 42.3 x 0.055^2] [IEDM 2008] ITRS MPU Model : [SRAM (6-transistor) Cell Area = 60f2 = 60 x (M1 h-p)^2] “22 nm”/38.9nm h-p, 0.063 um2 [= 41.6 x 0.028^2] [Simulation ca. 2008] 4x20 = 80nm vs. actual “32 nm”/56.25nm h-p, 0.171 um2 [= 54.0 x 0.05625^2] [ca. 2009] 2008 Consortium FinFET Design Factor = 42? vs. ITRS = 60 for planar SRAM 2009 60x0.05351u^2 = 171.8u2; also 60 for planar SRAM 2011 60x0.03784u^2 = 85.9u2 and vs. actual IDF’09 54 @ 56.25nm/”32nm” 0.171u2 area; and calc. from .092u2 area IDF’09: 58 @ 39.78nm/”22nm” : http://www.slideshare.net/finance6/intel-pdf-32nm-technology-update-mark-bohr http://download.intel.com/pressroom/kits/events/idffall_2009/pdfs/IDF_MBohr_Briefing.pdf Eq.GLph= ???nm !?
http://en.wikipedia.org/wiki/Tri-gate_transistors_(Intel)#Tri-gate_transistors_.28Intel.29http://en.wikipedia.org/wiki/Tri-gate_transistors_(Intel)#Tri-gate_transistors_.28Intel.29 http://arstechnica.com/business/news/2011/05/intel-re-invents-the-microchip.ars/2 ^"Intel Reinvents Transistors Using New 3-D Structure". Intel. http://newsroom.intel.com/community/intel_newsroom/blog/2011/05/04/intel-reinvents-transistors-using-new-3-d-structure. Retrieved 5/4/2011. - http://newsroom.intel.com/docs/DOC-2032 ^ ab"Transistors go 3D as Intel re-invents the microchip". Ars Technica. 5 May 2011. http://arstechnica.com/business/news/2011/05/intel-re-invents-the-microchip.ars. Retrieved 7 May 2011 Work in Progress - Do Not Publish


![2011 ITRS Emerging Research Materials [ERM] July 10-13, 2011](https://cdn2.slideserve.com/4220097/2011-itrs-emerging-research-materials-erm-july-10-13-2011-dt.jpg)