Download
1 / 35
360 likes | 523 Vues
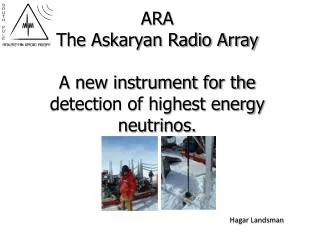
ARA The Askaryan Radio Array A new instrument for the detection of highest energy neutrinos. Hagar Landsman, UW Madison. High energy neutrinos….Why ?. There is a high energy universe out there we know very little about! Cosmic rays with energies of more than 10 20 e were observed.

E N D
ARAThe Askaryan Radio Array A new instrument for the detection of highest energy neutrinos. Hagar Landsman, UW Madison
High energy neutrinos….Why ? • There is a high energy universe out there we know very little about! • Cosmic rays with energies of more than 1020 e were observed. • Their source, or acceleration mechanism are unknown. • HE Neutrinos are expected to be produced together with photons and protons: • Neutrinos add complimentary information to gamma astronomy • With neutrinos we can look further away • Sufficiently energetic Cosmic rays interact on photon background and loose energy • No energetic CR from large distances (>50MPc) • Flux of neutrino : “Guaranteed source” n + p+ P+g p + p0 p + g D * n + p • + g venm ne m + nm p + e- + ve ve p+ g D * n + p e + nm +ne venm ne Cosmic Rays Gamma rays ve Neutrinos ve : vm : nt= 1 : 2 : 0 p
Why not Build a Larger IceCube?IceCube can detect cosmogenic neutrinos, but not enough of them … Simulated 9EeV event IceCube (80 strings) • With Current IceCube configuration: • Effective area ~0.1 km2 (1 PeV) - ~2km2 (100 EeV) • Yields less than 1 cosmogenic event/year • Lets make IceCube larger: • Some geometry optimization is possible, though: • Still need dense array scattering requires many hits for successful reconstruction • Still need deep holes for better ice • Any additional string will cost ~500K $* More than 60% of DOMs triggered A larger detector requires a more efficient and less costly technology. *Rough estimation, Including hardware, deployment, pole operation and overhead.
Solution: Use Cherenkov photons in Radio frequencies ! • Longer attenuation length in ice – larger detector spacing • Less scattering for RF In ice. • Cherenkov radiation pattern is preserved • Don’t need many hits to resolve direction • No need to drill wide holes • Better ice at the top. No need to drill deep. • Antennas are more robust than PMTs. • The isolated South Pole is RF quite • Any EMI activity is regulated • 2.5km ice depth contribute to effective volume • It is easy to detect RF Gurgen Askaryan (1928-1997) Remember: Less photons are emitted in longer wave length. Smaller signal in the radio frequencies…. But for high energy cascades this RF radiation is enhanced “Askaryan effect” Pavel Alekseyevich Cherenkov (1904-1990)
Past Antarctic Askaryan detectors – RICE array ofsingle dipole antennas deployed between 100 and 300m near the Pole. covered an area of 200m x 200m. (mostly in AMANDA holes) Used digital oscilloscope on surface for data acquisition IceCube Radio Co deployed with IceCube at 30m, 350m and 1400 m. Full in ice digitization. ANITA ANtarctic Impulsive Transient Antenna : surveys the ice cap from high altitude for RF refracted out of the ice (~40 km height of fly, ~1.1M km2 field of view)
The Game Plan Establish cosmogenic neutrino fluxes Resolve Energy Spectrum Neutrino direction Reconstruction Flavor analysis Particle physics • Energy reconstruction by denser sampling of each event • Small set of well established events. • Coarse energy reco • Angular resolution of less than 0.1 rad ~10 Events/year ~1000
ARA Concept Estimated Project cost: $7.7M • 80km2 area • 37 stations equally spaced on a triangular grid. • Relatively large separation between stations (1.3km) • 3 stations forms a “super cluster”. • Sharing power, comms, and calibration source. • Station: • 4 closely spaced strings. • 200m deep • Digitization and Triggering on surface • String: • 4 antennas, V-pol and H-pol • Designed to fit in 15cm holes. • 150-800 MHz sensitivity • Cable pass through antenna. DAQ Housing Vpol Antenna Hpol Antenna ~30m
ARA concept- • A single station can provide stand alone trigger. • Looking for down going events • interaction length 100-1000km • Detecting Events with zeniths between 45 above horizon and 5 below horizon • Entire thickness of ice sheet (2.5km) is used for the • highest energy events. • Optimizing design for efficient neutrino counting: • A single station can provide and form a trigger. • Goal is to count events, not reconstruct the angles as would be needed for observatory class instrument. • Decreases trigger time window, lowering background and therefore thresholds. • Lowers the energy threshold (lowest energies dominated by single string hits in a widely spaced grid). 200m ~30m 1300m 2.5 km
ARA expected performance Effective volume 200 km3 Ongoing simulation studies to optimize detector geometry, and make the best use of the 2.5km ice target Use entire thickness of icesheet! Effective Volume (km3) Low energy threshold! (due to cluster arrangement) Neutrino Energy (PeV)
Neutrino models and projected detector sensitivities Xx add AGN,GRB IceCube (3 years) Auger Tau (3 years) RICE 2006 ARA (3 years) Pure Iron UHECR ANITA (3 flights)
ARA expected performance Reconstruction • Vertex reconstruction : • Using timing information from different antennas. • Distance to vertex (for calorimetry) • Location of Vertex (Background/signal) • Neutrino Direction and Energy: • Combining amplitude and polarization information with Cherenkov cone models. • ARA is not optimized for this. Simulated Angular resolution: ~6°
Phase 1 - funded • NSF MRI-R2 Grant • 2010-2011 • Install testbed • EMI survey away from the station • Test ice properties • Begin testing station prototypes • Drill tests • 3 Wind turbines for testing • Calibration activities • Install 3 deep RF Pulser • 2011-2012 • Install ARA in ice station • Install Power/comm hub • 2012-2013 • Install ARA in ice station • Install autonomous Power/comm hub • ~80km2 array challenges: • Power source • Power and communication distribution • Drilling (dimension, depth, drilling time) • EMI
ARA Test Bed • Successfully installed ~1 km away from the South Pole station. • 16 antennas at different depths, down to ~20m. • Signal digitization and triggering happens on a central • box on the surface. • Power and comms through cables. • Current status: • Detector is up and running. Data coming in. • Very high efficiency and live time. • No unexpected EMI source. • Up to now, no evidence for wind generated EMI Time resolution plot
TestBed Installation December 2010
Additional deep pulsers on IceCube strings • last access to deep IceCube holes in 2010-2011 • 3 high voltage calibration transmitters installed on IceCube strings. • 2 at 1450 m (“shallow”) and 1 at 2450 m (“deep”). • Deep -can be seen at >km scale distances • Strong pulses ~5kV • Azimuthally symmetric bicone antenna -eliminates systematics from cable shadowing effects • Goals: radioglaciology and calibration
Deep pulser as seen by the testbed Deep (2450m) pulser seen by all antennas in the ARA testbed! Testbed is a horizontal distance of 2 km away- total distance 3.2 km. Points to an attenuation length of >700m (analysis ongoing).
Drill Test 1 : Rapid Air Movement • RAM drill • Cutter head drill hole-shavings extracted using compressed air • Extra compressors required at SP altitude • lots of cargo to get it to the Pole • Dry, 4 inch hole • Deepest holes achieved: ~60 m (only took 15 minutes!) • Limited by air pressure leakage through the firn
Drill Test 2 : Hot water drill • Carried on three sleds pulled by tractor • 0.5 – 1m per minute / 200m in ~1/2 day • 6” hole • Wet hole- must be pumped out or electronic made watertight • Deepest holes drilled in 10/11: ~160 m Drill in Operation ARA hot water drill sleds
Wind turbines • Three different turbines were installed. • Measuring and comparing wind speed, power yield. • Weather effect to be evaluated next summer.
Summary South Pole Ice Studies N(z), Atten Askaryan effect characteristics Simulation Ice Drilling South Pole EMI/RF enviroment Polar operation In ice electronics and hardware design In ice electronics and hardware design
Backup • Antennas design: • 150-850 MHz • Designed to fit in 15cm holes • Azimuthal symmetric • Cables pass through antena. No shadowing.
Tribute to ATLAS IceCube • Built upon success of AMANDA • Up to 86 strings of 60 digital optical modules(DOM) • 1450-2450 m deep • 17 m spacing between DOMs • 125 m triangle grid • Each DOM is an autonomous data collection unit • IceTop air shower array • 162 surface water tanks • Each contains 2 DOMs 25 m 45 m
Ice Properties: Attenuation length • Depends on ice temperature. Colder ice at the top. • Reflection Studies (2004) (Down to bedrock, 200-700MHz): “normalize” average attenuation according to temperature profile. Besson et al. J.Glaciology, 51,173,231,2005 • 2 on going “point to point” analyses using NARC/RICE and the new deep pulse.
Tribute to IceCube IceCube
Askaryan effect Hadronic EM Neutrino interact in ice showers Many e-,e+, g Vast majority of shower particles are in the low E regime dominates by EM interaction with matter Interact with matter Excess of electrons Cherenkov radiation Less Positrons: Positron in shower annihilate with electrons in matter e+ +e- gg Positron in shower Bhabha scattered on electrons in matter e+e- e+e- More electrons: Gammas in shower Compton scattered on electron in matter e- + g e- +g Coherent for wavelength larger than shower dimensions Moliere Radius in Ice ~ 10 cm: This is a characteristic transverse dimension of EM showers. <<RMoliere (optical), random phases P N >>RMoliere (RF), coherent P N2 Charge asymmetry: 20%-30% more electrons than positrons.
Salt Ice Typical pulse profile Strong <1ns pulse 200 V/m Simulated curve normalized to experimental results Measurements of the Askaryan effect • Were preformed at SLAC (Saltzberg, Gorham et al. 2000-2006) on variety of mediums (sand, salt, ice) • 3 Gev electrons are dumped into target and produce EM showers. • Array of antennas surrounding the target Measures the RF output • Results: • RF pulses were correlated with presence of shower • Expected shower profiled verified D.Salzberg, P. Gorham et al. • Expected polarization verified (100% linear) • Coherence verified. • New Results, for ANITA calibration – in Ice
Ice Properties: Index Of Refraction 1.77 • RICE Measurements (2004, Down to 150 m, 200MHz-1GHz) • Ice Core Measurements (…-1983, down to 237 meters) Kravchenko et al. J.Glaciology, 50,171,2004 ARENA 2010, Nantes IceCube RF extension Hagar Landsman
Ray tracing from pulser to SATRA Top antenna -5m surface Reflected rays Bottom antenna -35m Direct rays Depth [m] Source at -250m Measured time differences: Time differences between direct rays And between direct and reflected rays can be calculated XY separation [m] ARENA 2010, Nantes IceCube RF extension Hagar Landsman
How high is “highest energy”? • IceCube is optimized for energies 100-107 GeV • Getting beyond Deep core Ice Cube ARA -4 -3 -2 -1 0 1 2 3 4 5 6 7 8 9 10 11 MeV GeV TeV PeV EeV Log(Energy/GeV)
SN 104 Solar 102 100 10-2 Deep core Ice Cube Ice Cube EHE 10-4 10-6 dNn/dE*Ev2[GeV sr-1 s-1 cm-2] 10-8 Astrophysical neutrinos GZK 10-10 WIMP 10-12 -4 -3 -2 -1 0 1 2 3 4 5 6 7 8 9 10 11 MeV GeV TeV PeV EeV Log(Energy/GeV)
SATRA Average envelope WFs For In Ice Pulser events Hole 8, Bottom Hole 8, Top Hole 9, Bottom Hole 9, Top Hole 16, Bottom Hole 16, Top ~44 bins = ~139 ns Simulated results=137 ns Simulated results=14 ns ARENA 2010, Nantes IceCube RF extension Hagar Landsman
Askaryan effect is for real Extensive theoretical and computational modeling work exists. Verified in SLAC measurement Agreement between both
n_shallow n_c Based on set of hit time differences between antennas and between primary and secondary hits on the same antenna, a limit on the index of refraction model can be obtained. Systematics taken into account: n_deep, Geometry, timing resolution, WF features ARENA 2010, Nantes IceCube RF extension Hagar Landsman