Download
1 / 10
100 likes | 235 Vues
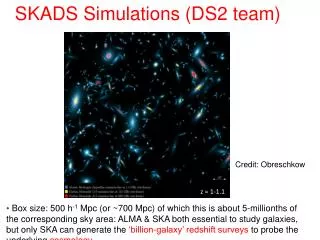
The SKADS project focuses on generating and managing large-scale sky simulations through continuum and HI line data. This document outlines the development of databases structured for efficient querying based on various parameters like source type, position, and flux limits. It includes the implementation of an interface for both Python and SQL, enhancing accessibility and interaction with vast datasets. The simulation output and Map Maker application illustrate the project's contributions to astrophysics, including the development of galaxy models and the integration of synthetic spectra in HI line observations.

E N D
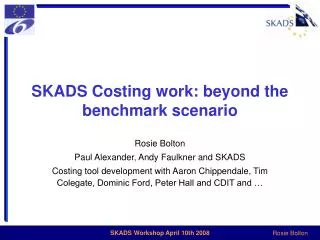
The SKADS sky and databases • F. Levrier, R. Wilman, D. Obreschkow, H.-R. Klöckner, S. Rawlings • (Oxford Astrophysics) • D. Olteanu, S. Young • (Oxford e-Research Center) DS2-T1 MEETING LISBON JANUARY 7, 2008
Output from continuum and line simulations • ASCII files • large quantities of data (~45 Gb) Example: continuum simulations - 235,301,766 sources
Data distribution and map making • Query data based on position, source type, flux limit... • Requires database structure (MySQL / PostgreSQL) • Continuum simulations database + HI line simulations database • For each database : source tables + cluster table Example: continuum simulations database Source table Cluster table • Unique source index per substructure • NULL values for Q,U,V fluxes • Max. number of entries per table: 1,000,000
Making the SKADS continuum sky Input map parameters region - source types - resolution - frequency - flux limit Query databases Read structure information position - size - orientation - reference fluxes Build template image Compute flux Scale template image Paste into full map
Making the SKADS HI line sky (I) First approach @ low resolution : synthetic spectra HI flux Synthetic double-peaked shape
Making the SKADS HI line sky (II) Second approach @ high resolution : template cubes from R. Boomsma • Galaxy models made of “clouds” • Placed according to density profile • Orbiting according to velocity curve • 5 galaxy types (spirals and irregulars) • 46 inclination values (0-90 degrees) • 5 asymptotic velocities scale / rotate / paste S0-Sab
Map Maker • Standalone application in Python / IDL • SQL/Python interface • FITS output
Central square degree of the continuum simulations Radio-quiet AGN FR I FR II “Normal” galaxies Starburst
Where we stand, where we’re going • Database implementation • IDL to python conversion of Map Maker • Release of central square degree data in the test phase (~100 Mb) http://webmail.jb.man.ac.uk/skadswiki/ContsimVersion4 • Testing of simulation output (T. Mauch, F. Abdalla, T. Kitching) • Hosting of the database server by OeRC • Implementation of web interface for database and imaging queries • Release of Map Maker • Release of the full simulations • Interface with a MeqTrees sky model
Measurement Set Generator • MeqTrees interfaces with AIPS++ Measurement Sets, but it doesn’t build them from scratch • Local MS generator: python interface to a glish script from T. Willis • Can use existing configurations or generate random ones