Download
1 / 33
340 likes | 567 Vues
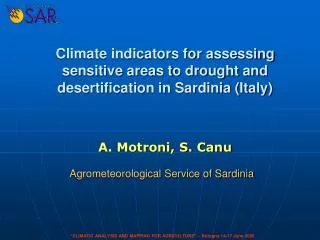
Climate indicators for assessing sensitive areas to drought and desertification in Sardinia (Italy). A. Motroni, S. Canu. Agrometeorological Service of Sardinia. “CLIMATIC ANALYSIS AND MAPPING FOR AGRICULTURE” – Bologna 14-17 June 2005.

E N D
Climate indicators for assessing sensitive areas to drought and desertification in Sardinia (Italy) A. Motroni, S. Canu Agrometeorological Service of Sardinia “CLIMATIC ANALYSIS AND MAPPINGFOR AGRICULTURE” – Bologna 14-17 June 2005
In 2000 the Agrometeorological Service of Sardinia started to develop a Geographic Information System for assessing and monitoring Environmentally Sensitive Areas to Desertification Applied methodologies:Desertification Prone Areas (Pimenta et al., 1997)Environmentally Sensitive Areas (ESAs) to desertification(MEDALUS Project (UE)Kosmas et al., 1997)Results: Map of vulnerable areas to desertification (scale 1:250.000)2001 Map of Environmentally Sensitive Areas to desertification (scale 1:100.000) 2004 “CLIMATIC ANALYSIS AND MAPPINGFOR AGRICULTURE” – Bologna 14-17 June 2005
SQI Soil Quality Index CQI Climate Quality Index ESAI VQI Vegetation Quality Index MQI Management Quality Index “CLIMATIC ANALYSIS AND MAPPINGFOR AGRICULTURE” – Bologna 14-17 June 2005
CQI Climate Quality Index Aridity index ESAs “CLIMATIC ANALYSIS AND MAPPINGFOR AGRICULTURE” – Bologna 14-17 June 2005
Objective: to show some aridity and drought indexes useful for assessing areas sensitive to desertification processes “CLIMATIC ANALYSIS AND MAPPINGFOR AGRICULTURE” – Bologna 14-17 June 2005
UNCCD(1):“Land degradation in arid, semi-arid and dry/sub-humid areas, resulting from various factors, including climatic variations and human impacts” (UNEP, 1994) ____ _________ ______________ __________________ Definition of “desertification” (1):United Nations Convention to Combat Desertification “CLIMATIC ANALYSIS AND MAPPINGFOR AGRICULTURE” – Bologna 14-17 June 2005
…, i.e. desertification is a complex phenomenon strictly dependent on climate “CLIMATIC ANALYSIS AND MAPPINGFOR AGRICULTURE” – Bologna 14-17 June 2005
Causes of desertification: Pressures on the territory: overgrazing, uncontrolled urbanization/country areas abandonment… Extreme climatic events: drought/floods Excessive exploitation of water resources Fires and deforestation “CLIMATIC ANALYSIS AND MAPPINGFOR AGRICULTURE” – Bologna 14-17 June 2005
Atmospheric conditions characterizing a desert climate lead to severe water deficit, i.e. potential evapotranspiration (ETo) values higher than precipitation values. Such conditions are calculated by several indices, the most used one is The bioclimatic index FAO-UNEP(1997), P/ETo. Considering this index, the sensible areas to desertification can be classified as follow: a) arid and semi arid P/ETo<0.50 b) dry/sub-humid 0.50<P/ETo<0.65 c) humid and hyper-humid P/ETo>0.65 DESERTIFICATION 0.03 > P/ETo > 0.75 NO DESERTIFICATION “CLIMATIC ANALYSIS AND MAPPINGFOR AGRICULTURE” – Bologna 14-17 June 2005
Reference period 1961-90 4,6% semi-arid 29,8% dry sub-humid 58,1% moist sub-humid 7,5% humid Carta P/ETo “CLIMATIC ANALYSIS AND MAPPINGFOR AGRICULTURE” – Bologna 14-17 June 2005
Aridity indexes: Bagnouls-Gaussen Index (meteorological deficit) Simplified Water Balance Index (hydrological deficit) Drought index Standardized Precipitation Index “CLIMATIC ANALYSIS AND MAPPINGFOR AGRICULTURE” – Bologna 14-17 June 2005
Aridity indexes - Input data Interpolationtechniques temperature -> multi-linear regression with residuals Kriging precipitation->Kriging/Co-kriging • Agrometeorological data • Daily ETo (Hargraves-Samani) • Daily ETa Climatic data About 200 stations Reference time period: 1961-90 Daily maximum and minimum temperature Daily precipitation • Pedological data • AWC data based on • soil type, texture, soil depth, chemical composition “CLIMATIC ANALYSIS AND MAPPINGFOR AGRICULTURE” – Bologna 14-17 June 2005
Bagnouls-Gaussen Index Number of days/year with 2T>P (climatic mean) Originally, ESAs methodology considered the Bagnouls-Gaussen aridity index: where BGI = Bagnouls-Gaussen Index Ti = Temperature of the i month (°C) Pi = Total monthly precipitation of the month i (mm) K = Frequency of the condition 2Ti-Pi>0 for the i month (%) In this way, the soil component is not considered! “CLIMATIC ANALYSIS AND MAPPINGFOR AGRICULTURE” – Bologna 14-17 June 2005
evapotranspiration coefficient soil water content in a given day soil available water content (AWC) Simplified Water Balance ETa = f xETo w soil water content t time S water surplus Pprecipitation ETaactual evapotranspiration wi = current soil moisturefor the iday wi-1 = soil moisture in the previous day P= precipitation ETo = potential evapotranspiration f= evapotranspiration coefficient f i-1 = wi-1/w*= evapotranspiration coefficient for the day i-1 w* = Available Water Capacity (AWC) (Reed et al., 1997) “CLIMATIC ANALYSIS AND MAPPINGFOR AGRICULTURE” – Bologna 14-17 June 2005
Aridity Index Simplified Water Balance For each year, aridity index values have been estimated computing the number of days in which soil humidity values were below different thresholds of AWC (0%, 10%,25%, 50%, 75%). The 50% threshold was used for calculating the aridity index in order to avoid over and underestimates of the index and to obtain a good spatial variability. “CLIMATIC ANALYSIS AND MAPPINGFOR AGRICULTURE” – Bologna 14-17 June 2005
BGI vs. Simplified Water Balance (Simplified Water Balance) “CLIMATIC ANALYSIS AND MAPPINGFOR AGRICULTURE” – Bologna 14-17 June 2005
The concept of aridity is already included in the definition of desertification (P/ETo) from a static to a dynamic analysis ESAs methodology should be integrated with an analysis of drought events What has been the trend of drought in Sardinia for the last 50 years? “CLIMATIC ANALYSIS AND MAPPINGFOR AGRICULTURE” – Bologna 14-17 June 2005
Standardized Precipitation Index (SPI) is a probability index that considers only precipitation. • The SPI is computed for several time scales, ranging from 1 month to 48 months, to capture the various scales of both short-term and long-term drought. • These time scales reflect the impact of drought on the availability of the • different water resources. • Positive SPI values indicate greater than median precipitation, while negative values • indicate less than median precipitation. A drought event occurs any time the SPI is • continuously negative and reaches an intensity where the SPI is -1.0 or less. The event • ends when the SPI becomes positive. The Standardized Precipitation Index, SPI(McKee et al., 1993) “CLIMATIC ANALYSIS AND MAPPINGFOR AGRICULTURE” – Bologna 14-17 June 2005
SPI Advantages: • Low input data requirement (monthly P) • Availability of precipitation data • Good territorial distribution of rain gauges • Easy way to represent drought trends • Short and long-term drought events • are considered “CLIMATIC ANALYSIS AND MAPPINGFOR AGRICULTURE” – Bologna 14-17 June 2005
SPI calculation - Procedure to calculate the SPI is very simple. It is calculated by taking the difference of the precipitation from the mean for a particular time scale, and then dividing it by the standard deviation. - 102 rain gauges - time period:1951-2000 - time scales:1, 3, 6, 12, 24, 48 months Short-term drought Long-term drought affect affect ground water, stream flow, reservoir storage soil moisture conditions “CLIMATIC ANALYSIS AND MAPPINGFOR AGRICULTURE” – Bologna 14-17 June 2005
SPI - Geographic distribution of meteorological stations - Best and longer data series - Homogeneous distribution “CLIMATIC ANALYSIS AND MAPPINGFOR AGRICULTURE” – Bologna 14-17 June 2005
SPI classes classification The index is negative for drought, and positive for wet conditions. (<-2 / >+2) As the dry or wet conditions become more severe, the index becomes more negative or positive “CLIMATIC ANALYSIS AND MAPPINGFOR AGRICULTURE” – Bologna 14-17 June 2005
Negative trend 3, 12, 24, 48 month SPI “CLIMATIC ANALYSIS AND MAPPINGFOR AGRICULTURE” – Bologna 14-17 June 2005
Positive trend 3, 12, 24, 48 month SPI “CLIMATIC ANALYSIS AND MAPPINGFOR AGRICULTURE” – Bologna 14-17 June 2005
In order to estimate SPI trends, angular coefficients for each station and for each time scale were calculated and spatial interpolated (Spline techniques) “CLIMATIC ANALYSIS AND MAPPINGFOR AGRICULTURE” – Bologna 14-17 June 2005
89% - 102 meteorological stations 11% + “CLIMATIC ANALYSIS AND MAPPINGFOR AGRICULTURE” – Bologna 14-17 June 2005
3,12, 24, 48 month SPI trend maps “CLIMATIC ANALYSIS AND MAPPINGFOR AGRICULTURE” – Bologna 14-17 June 2005
Mean 1951-00 rainfall total “CLIMATIC ANALYSIS AND MAPPINGFOR AGRICULTURE” – Bologna 14-17 June 2005
Results • Negative SPI trends are found for almost all stations • Extreme drought events are mostly concentrated in the last two decades • of 1951-00 • Short time scale (3, 6 months) SPI maps show wider areas with negative • trends than long time scale (12, 24, 48 months) ones • 24 and 48 month SPI trend maps indicate - Sardinian areas already characterized by drier conditions (semi-arid and dry sub-humid) show a negative trend of precipitation in 1951-2000 • Only in some areas (north-east and south-west of Sardinia) • precipitation trends are close to remain the same or smoothly increase • probably due to rain regimes • More controversial is the situation in other areas • (central-eastern part of the region, for example) “CLIMATIC ANALYSIS AND MAPPINGFOR AGRICULTURE” – Bologna 14-17 June 2005
Next steps • to rebalance ESAs desertification methodology with the SPI drought index • to calculate an on-line SPI index (short term drought) for drought alert • taking into account also the 2000-2005 “controversial” period • to relate SPI calculation results with atmosphere circulation models • and rain regimes “CLIMATIC ANALYSIS AND MAPPINGFOR AGRICULTURE” – Bologna 14-17 June 2005
Conclusions • Drought study and monitoring should be included in any complex model • of desertification phenomena • In an already defined climatic area, drought indexes give a better • representation of weather effects on desertification than aridity indexes, • because • - climate variability is considered • - their relation to vegetation biomass fire risk, erosion resistance, etc. • SPI is a very useful and easy-to-apply drought index for determining • possible climatic areas and weather conditions which can lead to • desertification processes • trends derived from long-time scales (24, 48 months) SPI can be useful • tools for assessing drought-bound areas “CLIMATIC ANALYSIS AND MAPPINGFOR AGRICULTURE” – Bologna 14-17 June 2005
Environmentally Sensitive Areas to desertification Scale of the study 1:100’000 Grazie ! mailto:motroni@sar.sardegna.it www.sar.sardegna.it