Industry Analysis
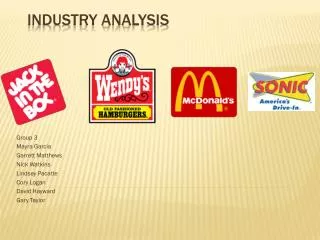
Group 3 Mayra Garcia Garrett Matthews Nick Watkins Lindsey Pacatte Cory Logan David Hayward Gary Taylor. Industry Analysis. Wendy’s founded by Dave Thomas Went to work for Hobby House Turned the three restaurants around became a millionaire. Wendy’s Organization.

Industry Analysis
E N D
Presentation Transcript
Group 3 Mayra Garcia Garrett Matthews Nick Watkins Lindsey Pacatte Cory Logan David Hayward Gary Taylor Industry Analysis
Wendy’s founded by Dave Thomas Went to work for Hobby House Turned the three restaurants around became a millionaire Wendy’s Organization
First Wendy’s November 15, 1969 Columbus Ohio Offered a homey place and fast food Made to order hamburgers First Wendy’s
1st to offer never frozen and fresh beef 1st to offer salad bar and baked potato Creation of modern day pick-up window Dave’s Innovation
April 2008 Wendy’s and Arby’s parent companies Merge Create 3rd largest fast-food restaurant chain in the United States with 12.5 B sales, 10,000 units Today Wendy’s has more than 6,600 restaurants in the US and other markets Wendy’s/Arby’s Merge
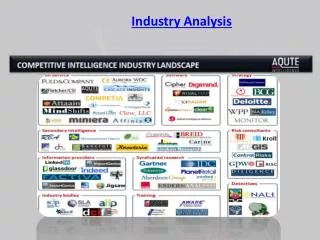
8 million restaurants in the world and some 300,000 restaurant companies • Divided into full service and fast food • The fast food industry is exceedingly fragmented • The top 50 companies hold about 25 percent of industry sales. Industry Overview
Wendy’s is a QSR Competitors that we compared to Wendy’s are McDonalds, Jack-in-the-Box, and Sonic Taken as a whole, restaurant sales have been increasing just over 5% annually. Industry Overview
The full-service restaurant segment of the foodindustry is anticipated to generate $173 billion in sales Fast food and quick service restaurant industry includes about 200,000 restaurants with combined annual revenue of $120 billion. Annual Sales
Made up of 12.2 million employees and is highly labor intensive. Restaurant industry workers make up 9 percent of the nation’s workforce. By 2015, the restaurant industry is predicted to add another 1.8 million positions. Diversifying Workforce
Increasingnumber of foreign-born workers in theUnited States • According to the U.S.Census Bureau there are 33.5 millionforeign-born individuals in the UnitedStates who make up 11.7 percent of thetotal population. • Presence offoreign-born workers in the restaurantworkforce is anticipated to swell in thecoming years. • The supply of workers age 16 to 24 has been declining Diversifying Workforce
Rivalry Among Existing Firms • Threats of New Entrants • Threat of Substitutes • Bargaining Power of the Customer • Bargaining Power of Suppliers Porter’s Five Forces Model
Help measure the level of profitability QSR has intense competition for growth in the market Customers face low switching costs QSR is labor intensive with low knowledge required Low level of growth increases the rivalry Rivalry among Existing Firms
QSR does not face many exit barriers The industry is risky to enter All firms offer same basic items Differentiate through design, variety, quality, and speed Rivals Continued
Economies of Scale Capital Investment Requirements Access to Distribution Channels Reaction of Other Industry Players Threat of New Entrants
Economies of Scale • In mass production, as production efficiency increases; cost decreases • Total assets: cash, inventories, property and equipment, and trademarks Threats of New Entrants
Capital Investment Requirement/Legal Barriers • Stay up with location of units, quality and speed of service, attractiveness of facilities, effectiveness of marketing and new product development • High overhead cost: rent, labor, rates and bank interest charge • Franchise ($250,000 to $1M) • High start-up and ongoing capital requirements • State/Federal regulation • Federal Trade Commission • Americans Disabilities Act • Trademarks and patents • Brand awareness Threat of New Entrants
Access of Distribution Channels • Acquiring subsidiaries • Wendy’s Bakery Co. • Established relationships with suppliers Threats of New Entrants
Reaction of other industry players • Starbuck coffee vs. McDonalds premium coffee • Dollar Menu • Who was the first to use the dollar menu? • Healthy fast food • Baked potatoes • salads • Yogurt • Bananas Threats of New Entrants
The threat of substitutes in the industry is very high • Many store locations and companies • A choice in the type of quick-service restaurant • One industry competitor of the QSR is the Full-Service Restaurant Industry • Offers higher levels of service at higher prices • More focus on food quality Threat of Substitutes and the Quick Service Restaurant Industry
The general state of the economy • When consumers have more disposable income they will often choose higher quality food • Societal views and perceptions • Consumers are becoming more health conscious; this leads them to avoid many firms within the QSR industry Threat of Substitutes based on Environmental factors
The age of the consumer • Older customers prefer higher service and food quality • Mood of the customer • Families or couples who desire to eat and relax will see firms in the FSR industry as the obvious choice Substitutes based on Environmental Factors continued…
“Definition” Their ability to set their prices for their customers Truly competitive market Best Deals = Long working relationships Bargaining Power of Suppliers
“Factors” Differentiation of Inputs Switching Cost Substitute of Products Importance of Volume to the Supplier Cost Relative to the Total Purchase of Industry Bargaining Power of Suppliers
Bargaining Power is Highest When: Sellers product has few substitutes and is important to buyer When differentiation makes it costly to switch suppliers When suppliers can vertically integrate and compete with buyer When buyers can’t vertically integrate backward and supply their own needs Bargaining Power of Suppliers
The QSR products are undifferentiated Companies must compete on price to attract customers This gives the customers a high amount of bargaining power Customers determine what products are offered Customers determine what the price the products Bargaining power of Customers
Even though the economy is in a downturn QSR companies sell a product that is ideal for the current economic environment QSR companies are still posting growths in sales and revenues QSR companies are still expanding their operations Economic factors in the environment
Economic factor implications for the QSR The current recession gives QSR companies the ability to weather the storm Could use the opportunity to take market share away from full-service restaurants Low borrowing costs can allow them to expand into new markets Economic factors in the environment
The firms in the QSR compete on Low price so they must continuously strive to cut costs Competing on price forces QSR companies to take small margins on products Successful competition depends selling a large volume of products Competitive factors in the environment
The competitive implications for the QSR To survive in the QSR a company must have a large number of restaurants Only a few companies are able to compete on a global scale However regional and hometown offerings can compete on a small scale To compete with the smaller firms QSR companies must improve customer service Competitive factors in the environment
Technology within the QSR has helped firms gain market share from other suppliers • Point of Sale (POS) • Order taking • Speed of service • Computer capabilities Technological
The Labeling Education and Nutrition Act (LEAN Act) legislation is the first of its kind affecting prepared foods which would require chains with more than 20 units to post calorie counts for all menu items Requires packaged foods to include nutrition information. LEAN Act
Wendy’s alone has over 6,600 stores in 20 countries Though Wendy’s has merged with Triarc, both entities have decided to continue running independently of one another Geographical Features
In the four highest populated states, Wendy’s operates over 1,400 stores The majority of Wendy’s locations are in the Central and Eastern regions of the United States Geographical Features continued…
Disposable Income • Teens in the US have large amounts of disposable income • The United States’ middle class • Working adults spend 1/3 of the day working, QSR firms rely on these individuals picking up food on their commute home • Religious and Cultural challenges • McDonalds and the non-beef patty in India • Social Hierarchies aren’t present in parent country Social Factors influencing the Industry
Ability to pay back short-term debts with current assets Industry as a whole seems normal Inventories can be converted to cash quickly Current Ratio
Gross profit margin • Measures the ability to generate earnings compared to expenses • Ratio gives proportion of money left over for revenue after cost of goods sold
Net Profit margin • Tells the company if it is effective at controlling costs • Net Profit Margin is the return on sales
Return on assets • Return on investment from stockholders and creditors • Helps company see how efficient the company is at generating revenues compared to use of assets
Return on equity • Rate of return on stockholders’ investment in the company • How much profit the company is generating with the stockholders’ money
Debt-to-Asset Ratio • Measures company’s ability to pay debt • Measures solvency • Little volatility within companies; but all are satisfying debt requirements