Research Questions, Variables, and Hypotheses: Part 1
Research Questions, Variables, and Hypotheses: Part 1. PHC 6700/RCS 6740 2/14/06 Happy Valentine’s Day! . Overview. Research always starts from somewhere! Ideas to conduct research projects come from: Prior Experience Recent Literature Personal Interest Intuition Need.


Research Questions, Variables, and Hypotheses: Part 1
E N D
Presentation Transcript
Research Questions, Variables, and Hypotheses: Part 1 PHC 6700/RCS 6740 2/14/06 Happy Valentine’s Day!
Overview • Research always starts from somewhere! • Ideas to conduct research projects come from: • Prior Experience • Recent Literature • Personal Interest • Intuition • Need
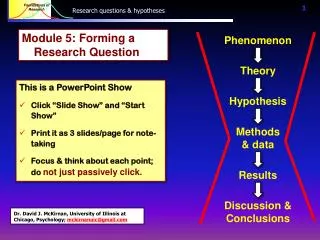
Basic steps to scientific research • Posing of a question • Developing procedures to answer the question • Planning for, and making appropriate empirical observations • Rationally interpreting these empirical observations
Terms • Data – collected empirical observations • Facts – events that can be directly, empirically, and repeated observed • Behaviors – can be verbal or nonverbal. • Observation – empirical process of using one’s senses to recognize and record factual events • Inference – an intellectual process in which some conclusions are derived from observed facts or from other ideas • Constructs – some non-observable, inferred events that are rational ideas constructed by researchers (i.e., memory, attitude, personality, perception, etc.) • Reification of a construct – confusing a construct for a fact.
Inductive & Deductive Reasoning • Inductive Reasoning • Begins with empirical observations then infers constructs • Deductive Reasoning • Using constructs as a basis for making predictions about new observations.
Theories • Theory is a formalized set of concepts that summarizes and organizes observations and inferences, provides tentative explanations for phenomena, and provides the basis for making predictions (Graziano & Raulin, pp. 37, 38). • Must be able to test a scientific theory • Parsimony: straightforward, economical, practical • Validity: A theory must make specific testable predictions that can be confirmed via observations.
Models • Most psychological theories are “Functional.” • Equal emphasis on induction and deduction • Organizing knowledge • Predicting new observations • Explaining relationships • Models: • Less developed than formal theories • Represents reality – but does not duplicate it. • Models are simplified representations of phenomena • Models provide convenient, manageable representations of a more complex, unknown reality • Models are incomplete, tentative & analogical • Manipulating models helps organize info to illustrate relationships and create new ideas or predict new observations
Phases of Research • Idea-generating phase • Problem-definition phase • Procedure-design phase • Observation phase • Data-analysis phase • Interpretation phase • Communication phase
Levels of constraint of research • Naturalistic observation • Researcher should do nothing to limit or change environment • Case-study research • Mildly limiting environment and observing participant’s responses • Correlational research • Measurement procedures must be carefully defined and precisely followed. • Differential research • Setting is usually highly constrained and measurement procedures carefully defined and precisely controlled. • Experimental research • Similar to differential research – participants are assigned without bias to groups or conditions of the study.
Basic & Applied Research • Most of SBS/rehabilitation counseling research is “applied.” Meaning…it focuses on real-world problems. • “Basic” research increases scientific understanding of phenomena, but has little to no interest in a practical goal. “Basic” research is often incorporated into “applied” research. • Solving practical problems requires background knowledge – much of this comes from basic research. As background knowledge grows, practical problems can be solved or answered. • Line between “Basic” and “Applied” research can be a little vague.
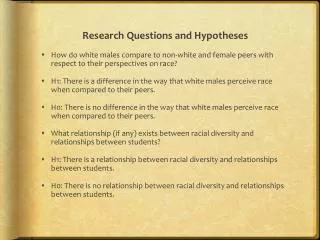
Research Questions • Questions that guide your research. Ideally, a research question should be debatable and of interest to both you and your potential readers. • It should also be based on a narrow topic. For instance, if you began your research with a broad, general interest in rehabilitation from Stroke, you might narrow your focus enough to ask the research question, “Does stroke rehabilitation (i.e., Physical Therapy, Occupational Therapy, Speech and Language Therapy) influence the psycho-social aspects of recovery?"
Research Questions Cont. • Remember, Research Questions should guide your research. • You can have more than 1 Research Question in a study • Example: What is the lived experience of a Doctoral Student? • What is their life like • What challenges do they face • How do they overcome challenges • What are characteristics of a Doctoral Student
Research Questions Cont. • Whatever form the question takes, it needs to be well-defined. One useful way of focusing a research question is to use the PICO approach: • People, patients or population- who are you asking the question about? • Intervention- what intervention are you interested in? • Control or comparison- what are you comparing the intervention to? • Outcome- what outcome are you interested in measuring? • Although this approach may only seem relevant to experimental research, with some minor modification it can be applied to studies of causation, diagnostic tests or prediction.
Research Questions Cont. • Your turn, give it a shot! • Applied Research Questions • Basic Research Questions
Variables • What are Variables? • Variables are the building blocks of hypotheses that are held together by the “glue” of the relationship we are studying. • As with most other facets of research, there are a wide range of definitions and categories of variables.
Definitions of Variables • “A variable is anything that can take on different values” (Marczyk, DeMatteo, & Festinger, p. 3 & 42). • Williams (1986) defines a variable as “an observable characteristic of an object or event that can be described according to some well-defined classification or measurement scheme” (p. 4). • Bolton and Parker (1992) define a variable as “characteristics of persons or things that can take on two or more values” (p. 341). • A key element is that variables refer to characteristics that are not fixed but are able to vary, that is, to take on more than one value. For example, the word “green” would not be a variable but “shades of green” could be a variable. “One inch” is not a variable, however, “length”, which could be operationally defined as the number of inches as measured by a ruler would be a variable.
Variables Cont. • A big area of confusion seems to be the difference between variables and values of variables. Many individuals will incorrectly define a value of a variable as the variable. • Following are some examples of variables and some of there potential values
Variables Types of Beer Hair Color Grades IQ (As measured by the Weschler) Attitudes towards People with Disabilities (As measured by the Modified Issues in Disability Scale) Variable Values Sam Adams, Bud, Corona Blonde, Black, Brown, Red A-E 85, 101, 124, 199 (Dr. Dodge’s) 0-252 Variables and Variable Values
Classification of Variables • By their nature: • Behavioral Variable (an observable response of an organism) • Stimulus Variable (specific factors that have either potential or actual effects on organism’s responses) • Organismic Variable (characteristics of organism used to classify for organism for research purposes) AKA “subject variables”
Classification of Variables • Experiment to determine if caffeinated beverages will reduce the amount of sleeping of graduate students during a research methods class? • What are the variables? • What are the natures of these variables?
Classification of Variables • Another one… • Experiment to determine the effects of paroxetine on anxiety. • What are the variables? • What are the natures of these variables?
Understanding variables in light of their research use. • There are three characteristics of variables that are necessary considerations in most research; they are: • A. definition, • B. function, and • C. type of measurement (i.e., measurement scale)
Variables: Definitions • An operational definition “assigns meaning to a construct or a variable by specifying the activities or “operations” necessary to measure it...It is a specification of the activities of the researcher in measuring the variable or manipulating it” (Kerlinger, p. 28). • Types of operational definitions are: • (a) measured, “which describes how a variable will be measured” and includes the source of the data (e.g., a specific standardized instrument or author developed questionnaire) • (b) experimental, which “spells out the details of the investigator's manipulation of the variable” (Kerlinger, 1986. p. 29) (e.g., the specific details and procedures of the intervention or treatment).
Variables: Definitions Cont. • Let's consider two hypotheses: • Hypothesis: Rewards increase punctuality. • The variables are rewards and punctuality. • A definition of rewards might be: Giving out candy and soda during the first five minutes of class. Depending on the design, this might be an experimental definition. • A definition of punctuality could be the number of minutes after 2:00 that the person arrived as recorded by the class timekeeper.
Variables: Definitions Cont. • Hypothesis: Training needs are related to length of experience. • Training needs could have more than one operational definition. For example, we might define training needs as the score on the counseling subscale of the Training Needs Inventory (TNI) and the score on the vocational issues subscale of the TNI. Alternatively, we could define training needs as the total score of the TNI. We could also define training needs according to a different instrument. • Length of experience could be defined as the number of years of experience on a specific job. Alternatively, length of experience could be defined as the total number of years a person worked in a particular profession.
Variables: Definitions Cont. • As you can see, the way variables are defined or operationalized is usually up to the researcher. One must explain how something is defined (although some researchers don't do a good job in this area) and why a particular definition was chosen. The way we define a variable can greatly influence research findings. Recall the elephant story. • Operational definitions of variables must indicate how participants are treated or measured. Note that they must indicate the source of the data (e.g., scores on a specific scale of an instrument, responses on a demographic questionnaire). • The trick in evaluating the adequacy of operational definitions is to ask the following questions: • Would someone unfamiliar with the authors' work be able to replicate it? • Is sufficient detail provided to give a replication recipe or blueprint?
Variables: Definitions Cont. • Once again, it is your turn! • Please define the following variables: • Depression • Hunger • Age • Exercise • Punishment
Variables: Functions • Variables have different functions. These functions are most frequently related to • (a) presumed causality and to • (b) the purposes of the inquiry.
Presumed Causality • A. Variable functions related to presumed causality include independent and dependent. • Independent variable: “…is the factor that is manipulated or controlled by the researcher” (Marczyk et al. 2005, p. 42)A variable that is “independent of the outcome being measured. More specifically…[it is] what causes or influences the outcome” (Marczyk et al., p. 46). • Note that classification variables can also be independent variables. • Also referred to as Explanatory Variables
Variables: Function Cont. • Dependent variable: “is a measure of the effect (if any) of the independent variable (Marczyk et al. 2005, p. 44) • The term dependent implies “it is influenced by the independent variable (Marczyk, et al, p. 46). • Response variable or output. The factor that is observed or measured to determine the effect of the independent variable (Tuckman, 1988). • Dependent Variables are also referred to as Outcome Variables • Note that the dependent and independent classifications are not as readily applicable to ex post facto studies in which relationships rather than causality are studied. They are similarly not applicable to descriptive studies.
Variables: Function Cont. • B. Variable functions related to the purposes of inquiry include Moderator and Control. • We introduce control variables to remove their influence from the relationship of the other variables, • whereas, we introduce moderator variables to further elucidate the nature of the relationships among the variables.
Variables: Measurement Scales • There are two different scales for measurement of variables. • Variables can be: continuous or categorical (Kerlinger, 1986) AND • Variables can be nominal, ordinal, interval, or ratio (Williams, 1986)
Variables: Measurement Scales Cont. • Continuous or Categorical • Continuous variables have an ordered set of values within a certain range. Values between two points (e.g., 4 and 5) on the range actually mean something. In other words, if a person scored 4.5, they scored more than someone who scored 4 and less than someone who scored 5. • Categorical variables (i.e., discrete variables) are measured in categories. An observation is either in a category or it isn't. There is no meaningful “in between” option. For example, cars might be categorized as domestic or imported. Categories must be mutually exclusive and exhaustive.
Variables: Measurement Scales Cont. • Nominal, Ordinal, Interval, or Ratio • Nominal: Names, classes, or symbols designating unique characteristics - simple classification, no order. • Ordinal: Assignment of numbers of symbols indicates order of relationship. Order only is indicated; there is no indication of amount. For example if an ordinal scale used the numbers from 1 to 6, one could say that 6 was greater that 3, but one could not say that it was twice the value of 3. Further the value of 4.5 would have no meaning in such a scale. Rank order data is an example of ordinal data.
Variables: Measurement Scales Cont. • Interval: This type of data has the same ordering properties as ordinal data and it also has equal, meaningful intervals and an arbitrary zero point. Therefore in an interval scale, 4.5 would be meaningful. • Ratio: This type of data has the same properties as interval data and also has an absolute zero point. In a ratio scale, 6 would be twice as much as 3.
Variables: Measurement Scales Cont. • Relating the Two Scales • Categorical: Nominal (Ordinal?) • Continuous: (Ordinal?) Interval and Ratio • When planning data collection, ALWAYS TRY TO COLLECT DATA IN CONTINUOUS FORM (unless it really confounds your collection strategy). CONTINUOUS DATA CAN ALWAYS BE CATEGORIZED LATER IF DESIRED FOR ANALYSIS, BUT CATEGORICAL DATA CANNOT BE READILY TRANSFORMED INTO CONTINUOUS. • For example, instead of asking people to mark one of six age categories, one could simply ask their date of birth. So, why do we care about scales? Among other reasons, scales determine the type of statistics that can be used. Parametric statistics are only appropriate with interval or ratio data. Nonparametric statistics must be used with nominal and ordinal data.
Treatment Group (Exercise) Control Group (No Exercise) Levels of VariablesTwo Group Comparisons
Levels and Factors • The most basic experimental design has two variables • Independent Variable • Dependent Variable • The independent variable has two Levels • Experimental Group (Usually receives treatment) • Control Group (Usually does not receive treatment) • A study can also have two different amounts of an independent variable • 10 mg of Prozac for one group and 20 mg of Prozac for another group • Example: A Randomized and Controlled study looking at the effects of exercise (Independent) on body fat (Dependent) • Group 1 exercises 3 times a week for 6 weeks • Group 2 does not exercise at all for three weeks Researchers will compare the body fat of those who exercise to those who do not.
Levels and Factors Cont. • A grouping variable is called a “Factor” • The number of groups are called “Levels” • A 2 level variable design can be expanded to include as many levels as needed!
Multiple Independent Variables • Designs that include more than 1 independent variables (Factors) can be more meaningful than designs with only 1 Independent Variable! • Why?
In class exercise • Read the article assigned to you and: • Identify the research question(s) and/or hypotheses • Is the research based on a theory? If so which one? • What type of research design is used by the researchers? • What are the variables? What are the IV’s and DV’s • How are the variables operationalized? • What is the nature of the variables (behavioral, stimulus, or organismic)? • What type of scale is used for the variables (Nominal, Ordinal, Interval, Ratio). Is the variable categorical or continuous? • If applicable, how many levels and factors are mentioned in the study?