Download

1 / 65
650 likes | 992 Vues
Tennessee Successful Schools A Project of the State Improvement Grant Susan M. Benner, Ed. D. Anne McGill-Franzen, Ph. D. Kandy Smith, Doctoral Candidate University of Tennessee LEAD Conference October 5, 2009 Tennessee Successful Schools Project

E N D
Tennessee Successful Schools A Project of the State Improvement Grant Susan M. Benner, Ed. D. Anne McGill-Franzen, Ph. D. Kandy Smith, Doctoral Candidate University of Tennessee LEAD Conference October 5, 2009
Tennessee Successful Schools Project • Context of State Improvement Grant and Higher Education Task Force • High Need Elementary Schools • Literacy Focus
State Improvement Grant Serving identified schools preschool through high school, SIG helps sustain important services to schools, administrators, teachers, and students and their families so that children and youth will achieve strong literacy and pre-literacy skills • Literacy and SPED • Transition of SIG to system-level RtI consulting and professional development
Characteristics Participating Schools21 identified 14 participated • 12 schools in towns • 2 schools in cities • Enrollment of schools between 300 and 750 • Grades Served • 5 K-4 schools • 3 K-5 schools • 3 K-6 schools • 3 K-8 schools • Economically Disadvantaged (State Average: 54.7) • Below the state average: 3 schools • Above the state average: 11 schools • Lowest percentage in these schools: 42% • Highest percentage in these schools: 94%
School Characteristics • Percent MinorityState Average: 32% minority • Below the state average: 12 schools • At or above the state average: 2 schools • Lowest percentage in these schools: 1% • Highest percentage in these schools: 35% • Percent Special EducationState Average: 15.4% • These schools: (for 2007 only) • Below the state average: 9 schools • At or above the state average: 4 schools • Lowest percentage in these schools: 1% • Highest percentage in these schools: 25%
Perspectives from the FieldRegional Focus Groups Administrators Classroom Teachers Special Education Teachers Parents
Anecdotal or real-life experience of teachers is always going to trump research. Nelson, Leffler,& Hensen (2009)
General Question To what do you attribute your school’s success in literacy ?
Probes • How does your school overcome the challenges presented by the at-risk student population? • Reflect on the use of student assessment data in the school’s instructional planning? • How do teachers collaborate in supporting students with special needs or struggling readers in your school?
Probes Cont’d • How does the leadership in your school support its success? • Reflect on parent involvement in your school. • Reflect on the importance of professional development in your school’s success. • What instructional practices in your school do you think contribute to your success?
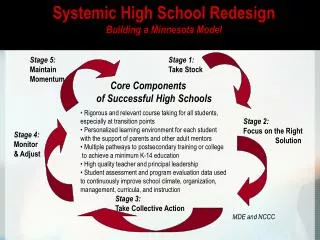
What do these successful schools look like? • Unique paths to success—there is no universal key to success • Each school has its own DNA—Education Trust, 2009 • Common patterns of effort that reflect the research base focused on schools that “beat the odds” • Shared characteristics across schools throughout this and other research
The Schools • Elvis Presley • James K. Polk • Richard Boyd • James Napier • Cordell Hull • Dolly Parton • Wilma Rudolph • Perry Wallace • Casey Jones • Nancy Ward • Alvin C. York • Pat Summit • Roy Acuff • Henry Foote
Elvis Presley Elementary School2003 - 2007 • K-5 and K-4 • Average enrollment 727 • Rural • 55% Economically Disadvantaged • Racial Composition • 70% White • 21% African American • 8% Hispanic • Less than 2% Asian 2003 Targeted assistance (AA and ED performance) 2004 - 2005 School improvement (AA and ED performance) 2006 - 2007 Good standing
James K. Polk2003 - 2007 • PreK - 5 • Average enrollment 262 • Average 55% economically disadvantaged • Predominately white • Increase in Hispanic from 0 to 4.6% • African American approximately 4% 2003--20% Below Proficient 2004 --13% Below Proficient 2005--4% Below Proficient 2006--7% Below Proficient 2007--6% Below Proficient Value-Added improved from C in 2003 to A from 2005 to 2007
Cordell Hull • K - 8 • 328 average enrollment, gradually declining • 98% economically disadvantaged • High referral rates to DCS • Children read better than parents • Over 91% white, declining • increase in Hispanic population from 3.3% to 10.5% • African American relatively steady with average of 10.7% 2003 Targeted Assistance 2004 - 2007 Good Standing Below Proficient ratings did not drop Value-Added went from F (2003) to A (2006-2007)
Perry Wallace Elementary • K-6 • Demographics • 233 • Rural • Economically Disadvantaged: As high as 97.2%, as low as 73.9% • 35% African American, 65% Caucasian • .4% Hispanic
Perry Wallace AYP Data • 2003 • F in Academic Achievement; F in Value-Added • 2004 • F in Academic Achievement; B in Value-Added • 2005 • F in Academic Achievement; B in Value-Added • 2006 • D in Academic Achievement; B in Value-Added • 2007 • C in Academic Achievement; A in Value-Added
Perry Wallace Elementary • In 2003, did not meet Federal Benchmark (X) • With the only two subgroups in which there were more than 45 students: • All students • Economically disadvantaged • In two main categories: • Reading, Language Arts, Writing • Math
Perry Wallace Elementary • 1 of 74 Reading First schools in Tennessee • Became a Reading First school in spring of 2004
James Napier • 2003: low achieving school, “targeted assistance” • 2004-2007: “good standing” • Percentage of students below proficient on TCAP assessments in reading and language arts reduced by around 50% in all subgroups, • Largest gains achieved with special education students • 2003: 70% of the students with disabilities were below proficient on the state assessment • 2007, 25% below proficient
James Napier • Academic achievement grades have risen from C in 2003 to B in 2007. • Value-added scores have risen from C in 2003 to A in 2007.
Dolly Parton Elementary • Grades PreK-6 • Demographics (2007) • 480 Students • Rural • 78 % Economically Disadvantaged • 95% White; 3.8% African-American; 1% Hispanic
Dolly Parton Reading Grades • 2003, 2004 • B in Academic Achievement; F in Value-Added • 2005 • B in Academic Achievement, A in Value-Added • 2006, 2007 • A in Academic Achievement, A in Value-Added
Percent of Students Proficient or Advanced in Reading Dolly Parton State All Students 2003: 80% 2007: 90% Students with Disabilities 2003: 2007: 70% • All Students 2003: % 2007: 95% • Students with Disabilities 2003: 2007: 86%
Overriding Forces • External support and effective ongoing professional development • Administrative leadership and standards • Collaboration between teachers • Grade-to-grade, SPED-to-regular, cross-grade • Dedicated time for engaged instruction • Connections between assessment and instruction, understanding use of data
External Support and Effective Ongoing Professional Development • Perry Wallace • Cordell Hull • Overriding Forces
Prevailing Theme: Rigor/Fidelity “What gets checked on gets done.” • Required Reading First Fidelity Checks • Administrator, Literacy Leader, Cadre Trainer • Tiers 1, 2, (Voyager) and 3 • Rigor logs • MORT: Missed Opportunities for Rigorous Teaching • Student data/assessments for interventions
Prevailing Theme: Collaboration • Leadership Team Collaboration • Principal, Literacy Leaders, Interventionists • Grade Level and Cross-Grade Level Collaboration • Professional Development • Shared Vision • Full inclusion school • School-wide behavior management (COMP)
Cordell Hull • Resources and professional development in literacy education provided through Reading First • Special and general education teachers participate in the same professional development
Learning to Change “ And I, I think, just explicit and systematic instruction has helped us so much…I’ve been there for 26 years, and I really thought I was a pretty good teacher. …some of the things, I mean not everything, but, I mean, some of the things that I’ve learned, and I’m thinking, what was I thinking?” “The dinosaurs, honey, let me tell you …’ it was hard… you know these new ones that came in they could do it snap, snap, snap…It takes a long time to re-train yourself to do this. But…I’ve embraced it and really… done well with it. And we teach the five components of reading…”
Administrative Leadership and Standards • James K. Polk • James Napier • Overriding Forces
James K. Polk • Strong principal focused on Student Performance Indicators • Requires weekly lesson plan reviews • Connections back to district office with assistance provided in data interpretation
James Napier: Administrative Leadership and Standards Special Education Teacher describes principal as “very supportive in anything you want to try” Gen Ed Teacher: “very much focused on SPIs…more focused on SPIs than on basals”
Collaboration between Teachers • Dolly Parton • Elvis Presley • Perry Wallace • James Napier • Overriding Forces
Dolly Parton: Theme 1 • Access to grade level curriculum with support enabled lowest achieving students to improve • The school moved to total inclusion for grades 3-6 • The school became school-wide Title 1 thereby gaining two teachers, assistants, and instructional coach • Title 1 teachers, assistants, and special education teachers push into classroom to support instruction during reading block
Dolly Parton: Theme 2 • Collaborative planning enabled adjustments to curriculum • The school initiated daily common planning and weekly grade level meetings • The instructional coach identified students for intervention based on mastery of SPIs • The special education and Title 1 teachers and assistants consulted classroom teachers’ posted plans • The special education teacher and classroom teachers monitored students’ progress on reading curriculum assessments
Dolly Parton: Theme 3 • Technology programs increased the time students spent reading • Two computer labs and classroom mini-labs with Study Island and River Deep software supported 40 minutes extra reading daily • AR libraries are located in every classroom
Most Important Element of School Success “We’re looking all the way down and we are beginning to see what we can do for all levels of students. And I think that comes through the collaboration that we now have with our teachers….They want to do the best job they can do and so they are looking for that communication….I think that’s what’s important.”
Inclusion Issues • “I’m planning probably an hour and a half or two hours a day after school and at home just making sure I am prepared for the next day…. And I am a veteran teacher….I love my intervention teachers, but I just don’t understand why they don’t have their own curriculum and why once kids are targeted they don’t pull them out and do a program.” Regular Education Teacher
Elvis Presley Elementary Collaborating on Lesson Plans on grade level and across grade levels Sharing responsibility for raising student achievement “…pulled together as a school, collaborated, approached the problem as a school problem, lots of crossover meetings to get communication flowing, a lot of hard work, a lot of meetings after school, a lot of dedication on the part of teachers to understand and accept we were going to have to work early and stay late to accomplish our goals…”
Perry Wallace: Collaboration • Leadership Team Collaboration • Principal, Literacy Leaders, Interventionists • Grade Level and Cross-Grade Level Collaboration • Professional Development • Shared Vision • Full inclusion school • School-wide behavior management (COMP)
James Napier: Collaboration Between Teachers “One of the best things that’s happened in the last couple of years just like some of you have already said, we have grade-level time now where we all have the same planning time, and so we have the freedom to collaborate and talk to each other and help each other because we’ve found that that’s probably the most successful thing that’s happened in the last few years is getting to talk to other people. And, you know, we constantly have new teachers coming in, and it really helps them out a lot, too.”
Dedicated Time for Instruction • Elvis Presley • Cordell Hull • James K. Polk • Perry Wallace • Overriding Forces
Elvis Presley • Protecting Instructional Time “…we look at our minutes of instruction and see how few we really have when you break it down, and we just can’t waste it, so we start looking at what we can eliminate and then we take it back…”
Cordell Hull • Differentiating instruction “…I have probably like 30 minutes of whole group a day, and that’s it. Everything else is small group, individual differentiated instruction.”