Download
1 / 64
640 likes | 758 Vues
This presentation explores the tests of Quantum Chromodynamics (QCD) in proton-proton interactions at the Large Hadron Collider (LHC) operating at 14 TeV. It delves into the Compact Muon Solenoid (CMS) experiment, emphasizing the Preshower Detector's critical role in photon identification. Key topics include the CMS software architecture, photon production mechanisms, and the optimization of lead absorbers to enhance trigger efficiency. The analysis highlights the significance of understanding QCD in the context of electroweak physics and searches for new particles, including the Higgs boson.

E N D
Tests of QCD in pp Interactions at 14 TeV Manoj Kumar Jha 5th March, 2007 Centre for Detector and Related Software Technolgy Department of Physics & Astrophysics University of Delhi
Outline • Large Hadron Collider (LHC) • Compact Muon Solenoid (CMS) Experiment • The Preshower Detector • Motivation • The CMS Software • Action on Demand • Stages of Reconstruction • Results • Optimization of transverse shaping of Lead absorbers in • the CMS Preshower • Direct Photons Production at LHC • Parton kT Smearing Effects in Direct Photon Production
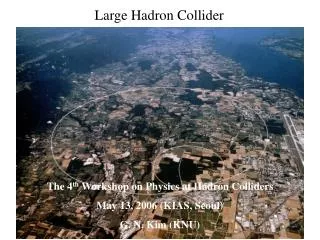
Large Hadron Collider (LHC), CERN • p-p Collider • Centre of Mass Energy = 14 TeV • Luminosity = 1034 /cm2/s • Physics at LHC • Search for SM Higgs Boson • SUSY Physics • B-Physics • New Physics • Test of QCD • Quark Gluon Plasma • Experiments at LHC • Compact Muon Solenoid (CMS) • ATLAS • ALICE • LHC-B
The Preshower of the CMS Detector Light Higgs : Hgg Major Bgd. : p0gg • The main function of the PSD is to provide g/p0 separation in Endcap.
The CMS Preshower • Why? • In Endcap region (1.65 < |h|<2.6), the important background to the “gold-plated” Hgg decay is p0gg (closely spaced), faking as real photon. • The main function of the PSD is to provide g-p0 separation • Components • PSD contains two thin lead ‘absorbers’ followed by Si micro-strip detector planes
Si Strip Detector for PSD Isometric view of the array of PSD, square arrays correspond to micro-module and Si detector Individual strips (32) Micromodule assembly Individual strips (32)
The CMS Software • COBRA: Framework & architecture implementation. • Geometry: Geometry description of the CMS • OSCAR: Object Oriented Simulation for CMS. • ORCA: Object Oriented Reconstruction for CMS Analysis. • IGUANACMS: Interactive Graphics for User Analysis for CMS. The main projects
OSCAR(Object Oriented Simulation for CMS Analysis and Reconstruction) • OO design. • Use Geant 4. • Detector description is handled by DDD which is a COBRA subsystem. • XML files with the actual detector configuration are under version control, managed by the Geometry project. DDD Basic Architecture
SimHits Stages of Reconstruction Produced by MC, stored in DB Include Pileup, some stored in DB (Tk) Digis Pre-processed digits, some stored in DB (Calo) RecHits Tracks, Clusters etc, will be stored in DB RecObj
Optimization of Transverse Shaping of Lead absorbers in the CMS Preshower has been cited in CMS Physics TDR Vol. I, Page No. 150
Outline • Motivation • Level-1 trigger algorithm • Level-1 trigger efficiency in presence of Preshower • How to optimize the lead shape ? • Optimization of lead shape around η=1.653 • Optimization of lead shape around η=2.6 • Summary
Motivation: Transverse Shaping of Lead Absorbers • Preshower fiducial coverage 1.653 < η < 2.6 • ECAL trigger towers in endcap are not in η & Ф. • Simple radial lead shaping does not match trigger tower boundaries (or any other physical boundary). • Partial coverage of crystals by Lead • Limitations within the ORCA • Level 1 Et are scaled without the knowledge of crystals covered by lead • Loss in L1 trigger efficiency at preshower boundaries. Motto of Work • Minimize loss of L1 efficiency while maintaining (as much as possible) full ES fiducial coverage. Layout of Preshower, Supercrystals and Trigger towers of ECAL endcap in fixed phi region eta = 1.653
CMS Level-1 Trigger Algorithm Leve1-1 trigger system detects signature of electrons/photons, taus, jets, and missing transverse energy and total transverse energy. • Based on a sliding windows technique which spans the complete η - φ plane. • Et cut = Et in central towers + highest Et in 4 towers which are adjacent to central towers. • Cuts for isolation • H/E < 0.05 • Sum of ECAL energy in remaining 8 towers < 2 GeV • Sum of Et in one of the 4 L-shaped regions about the central ECAL crystal < 1 GeV Electron/Photon Algorithm
Level-1 trigger efficiency in the presence of the Preshower • Level-1 trigger efficiency decreases by 1% after introduction of Preshower with • circular lead in the ECAL endcap. • The loss in the Level-1 trigger efficiency around η = 1.653 may be recovered if • the shape of lead is optimized in the transverse direction.
Distribution of number of brem candidates in an event No. of Brem ~ 6 No. of Brem ~ 6 Distribution of brem for events which have Level-1 isolated clusters Distribution of brem for events which have Level-1 non-isolated clusters • Number of brem candidates are same for events which have Level-1 isolated and non-isolated clusters.
Distribution of number of basic clusters Distribution of basic clusters for events which have Level-1 isolated clusters. Distribution of basic clusters for events which have Level-1 non-isolated clusters. • No. of basic clusters is large for events which have Level-1 non-isolated clusters • Events are depositing energies in more than one trigger tower. • It is failing the isolation cut of there being at least one quiet corner of electron/photon • algorithm of Level-1 trigger. • OR • Failing one of the four five-tower corners has all towers below a programmable threshold.
Distribution of ET of Seed Clusters for Superclusters Distribution of ET of seed clusters for events which have Level-1 isolated clusters Distribution of ET of seed clusters for events which have Level-1 non-isolated clusters • Falling PT distribution for non-isolated case is due to fact that events are depositing energies in several trigger towers.
Reasons for low Level-1 trigger efficiency around η = 1.653 • Self-vetoing by the isolation cut: If electron energy is split across non-adjacent towers then it might be suspected that this would lead to electrons appearing as non-isolated deposits because some of the electron’s own energy falls in the L-shaped region. • Splitting of Deposits: If the electron is incident on the tower corners where a shower can be almost equally split between four trigger towers resulting in an trigger Et much less the incident Et and may therefore fall below the trigger cuts.
How to Optimize the lead shape ? Extrapolated front face of crystal at the second plane of the lead Crystal in the ECAL endcap Extrapolated front face at the first plane of the lead Dimension of the crystals Length = 22.0 cm Rear Side = 3.0 cm Front Side = 2.8618 cm Taper Angle = 0.360 Each crystals in ECAL endcap are off pointing from Z = 0 and angle of “off pointing” depends on the location of the crystal in the ECAL endcap .
How to Optimize the lead shape (cont.)? • Constraints • Conditions • All lead must be covered by silicon sensors • Mechanical constraints • Horizontal & vertical cutting of Lead are easier • Things need to be considered • Thickness of the Lead • Spread of event vertex • Could shape according to trigger towers ? • Loss of preshower fiducial coverage due to variable size of trigger towers • Trigger tower geometry is not frozen eta = 1.653 eta = 1.6 eta = 1.8 phimax=34.16610 phimin = 28.3530
L1 Trigger Efficiency for Different Shapes of Lead in the Preshower 20 GeV Pt Electrons 10K Events/point Electrons fired in a fixed region of phi ( from 28.300 to 34.170) in ECAL Endcap • There is a clear improvement of L1 trigger efficiency at the boundary region • when the lead is shaped according to crystal dimensions, even though the • lead does not exactly match the crystal dimensions. • Lead should be shaped roughly according to the dimensions of the crystals • around η = 1.653.
Layout of region used in simulation around η = 2.6 • η = 2.6 represents the inner boundary of the Preshower. • Number in pink color represents the supercrystals ID of ECAL endcap available in ORCA. • Red rectangular blocks represents the layout of simulated Lead according to dimensions of the crystals in the ECAL endcap. • Events consist of single electron of PT of 20 GeV fired in η from 2.8 to 2.322 and in φ from 24.940 to 44.890 .
Leve-1 trigger efficiency as a function of the pseudorapidity • CMS Level-1 trigger algorithm finds isolated and non-isolated electron/photon • candidates in the region that extends in η from -2.5 to 2.5. • Level-1 isolated trigger efficiency is independent of shape of Lead absorbers. • Shape of the Lead should be circular around η = 2.6 otherwise it will incur additional • cost and manpower for shaping the Lead absorbers according to dimension of crystal • in ECAL endcap.
Summary • Around η =1.653, the Level-1 trigger efficiency decreases by ~ 3% even in absence of the Preshower. • Level-1 trigger efficiency decreases by further 1% around η =1.653 after introduction of Preshower with circular lead in the ECAL endcap. • Shape of lead has been optimized around η =1.653 • Lead should be shaped roughly according to the dimensions of the crystals in the endcap. • Loss in Level-1 trigger efficiency has been recovered after shaping the Lead according to dimensions of the crystals. • Shape of Lead should be circular around η =2.6.
Direct Photon Production at the LHCPublished in Phys. Rev. D., 67, 014016, Jan. 2003
Outline • Introduction • Production Mechanisms • CDF Data Analysis • Expectations at LHC regime -- Event kinematics -- LO & NLO Cross-sections -- Theoretical uncertainties: QCD scales & PDF’s -- Rapidity & Cone size dependence -- Background due to 0 decay
Physics Motivations: Why study Direct Photons? • Ideal testing ground for the essential validity of pQCD formalisms. -- photons are simple, well measured EM objects -- emerge directly from the hard scattering without fragmentation • Important to understand QCD of photon production in order to reliably search for Higgs -- direct photon pairs as major irreducible background to --Intermediate Mass Higgs boson discovery in the channel at LHC H
Physics Motivations: pros & cons of direct γ study Advantages over Jet/Hadron Study • Theoretical Simplifications -- Fewer subprocesses -- point-like coupling of the photon makes the higher- order QCD calculations relatively simple. • Smaller Systematic Uncertainties -- Energy resolution of ECAL is generally better than HCAL --Precise measurement of direction & energy of photons directly without the need for an algorithm to reconstruct a jet Disadvantages • Backgrounds copiously produced from neutral meson decays. • Lower event rate compared to jet production. • Complications from photons produced during jet fragmentation.
pQCD Predictions for Inclusive Cross-sections • Kinematical region pp→ γX at √s=14 TeV 20 GeV < pT < 400 GeV & –3 < η < 3 • LO QCD : PYTHIA 6.2 PDF—CTEQ5M1 Events Generated--105 Subprocesses: qg→qγ , qqbar →gγ & gg →gγ • NLO QCD Uses CDF Run 1B isolation cut which rejects events with a jet of ET > 1 GeV in a cone of radius 0.4 around the photon.
Direct Photons at LHC :LO Cross Section • Compton scattering provides the dominant contribution in the entire kinematical region • Contribution from annihilation scattering ↑ with ↑ pT ... • Gluon-gluon scattering contributes negligibly.
Direct Photons at LHC :LO & NLO Cross Section • NLO QCD contribution higher than the LO in the whole pT range under analysis. • K-factor = σ(NLO)/ σ(LO) of upto 2 at low pT • NLO contribution decreases in importance with rise in pT.
Pseudorapidity Spectrum of Direct Photons at LHC (High pT region) • η distribution is almost insensitive to the large-x behaviour of gluon distribution.
Direct Photons at LHC in Different Pseudorapidity Windows • As expected, direct photon cross section is more for larger η interval.
Cone Size Dependence of Direct Photons at LHC • Cross-section ↓ almost uniformly over the whole pT region with ↑ in cone size.
Summary • Quark-Gluon Compton scattering provides the dominating contribution in the entire kinematical region at LO QCD. • NLO contribution dominates at low pt and decreases in importance considerably at high pT. • NLO predictions depend only marginally on the choice of scales. • pT distribution –insensitive to PDFs at high pT, but quite sensitive at low pT • At low pT, rapidity distribution is much more sensitive to the small-x behaviour of gluon distribution. • Direct photons are produced fairly copiously in the central rapidity region. • Direct photon cross-section decreases with increasing cone size.
Parton kT Smearing Effects in Direct Photon ProductionPublished in Phys. Rev. D, Vol. 68, July 2003.
Outline • Highlights: Data vs Theory • -- kT Phenomenology • -- Modelling kT effects • Data Analysis • -- CDF & DØ Run 1b Data at 1.8 TeV & 630 GeV • -- NLO QCD (CTEQ6M) • Simulation of multiple soft-gluon effects (kT) • -- NLO QCD + kT Enhancement vs Data • Initial-State Soft Gluon Effects expected at LHC • Conclusions
Highlights: Data vs Theory • Global QCD analysis of direct production process : • A pattern of disagreements of data from NLO QCD predictions, both at collider and fixed-target regime. • Data display steeper pT dependence than theory in the low pT region • Deviation occurs at different x-values for expts. at different energies • New parton distribution functions, improved photon fragmentation functions & change of theory scales can not be expected to resolve the low pT discrepancy • Proposed Explanation: NLO calculation lacks kT-kick due to multiple soft-gluon emission J.Huston et. al., PRD 51, 6139 (1995)
KT Phenomenology • Conventional QCD hard-scattering formalism: interacting partons collinear with the incoming hadrons & outgoing partons are back-to-back kT = 0 • The incident partons may have some transverse momentum => net pT imbalance among the outgoing particles, • If the outgoing particles are photons or leptons, then QT should provide a good measure of kT:
Modeling kT Effects • Fully resummed PQCD description of soft-gluon emission effects in inclusive direct production still awaited. • Phenomenological kT-smearing model: -- Soft-gluon radiation is parameterized in terms of an effective <kT> that provides additional transverse impulse to the outgoing partons. -- because inclusive cross sections fall rapidly with pT, net effect of kT is to increase the yield – by factor K(pT) -- LO QCD calculations model incident-parton kT using Gaussian smearing. • No such smearing is available in current NLO calculations. Approx. Treatment: • Double counting of contributions is expected to be small. • <kT> values for calculations of K(pT) are consistent with observations.
Isolated Photon Cross section at s=1.8 TeV • Excess of photons over theory in • the low pT region • DØ and CDFdata are consistent • with each other • NLO calculations (Vogelsang) agree qualitatively with data over a wide range of pT.
Simulation of Soft-gluon Effects at s=1.8 TeV • PYTHIA: Default primordial kT distribution of 1 GeV & ISR on. • No. of ISR gluons is significantly larger than the NLO PQCD approx. of 0 or 1. • Net pT of remnant ISR gluons: ~2.2 GeV at pT(min)=10 GeV 4.5 GeV at pT(min)=50 GeV .
DØ Inclusive Cross section: kT Effects • PartonkT-smearing produces strong enhancement of cross section at low pT . • NLO theory + kT effects: successful to a great extent in describing the Data kT per parton ~ 3 GeV for s=630 GeV & ~ 4 GeV at s =1.8 TeV).
CDF Inclusive Cross section: kT Effects • PartonkT-smearing produces strong enhancement of cross section at low pT . • NLO theory + kT effects: successful to a great extent in describing the Data kT per parton ~ 3 GeV for s=630 GeV & ~ 4 GeV at s =1.8 TeV).
Conclusions • Data sets in the central region exhibit a steeper slope than the theoretical predictions at low pT . • Theoretical uncertainties from scale variations & choice of PDFs fail to explain the discrepancy at low pT. • Reasonably good agreement between data & theory in the Forward region. • NLO predictions + kT effects yield significantly better description of measured cross sections. • Better theoretical understanding of soft gluon effects would clearly benefit global determinations of G(x), especially at medium and large x values.