Download

1 / 50
510 likes | 886 Vues
Container transport chains and codification of commodities. Peter Smeets Senior statistical researcher Statistics Netherlands Working Party on Transport Trends and Economics Group of Experts on Hinterland Connections of Seaports Geneva, 28 October 2008. Overview of the presentation.

E N D
Container transport chainsand codification of commodities Peter Smeets Senior statistical researcher Statistics Netherlands Working Party on Transport Trends and Economics Group of Experts on Hinterland Connections of Seaports Geneva, 28 October 2008
Overview of the presentation • Users’ Needs • Data sources • A. Transport chains - Linking sources (problems en possibilities) - Examples • B. Commodities - Free text - Coding system - Validation - Provisional results • Future developments
Disclaimer • ”All data are provisional and may not be quoted or published” • ”The content of this presentation represents the personal views of the author and need not necessarily coincide with those of Statistics Netherlands “ • It is a pilot study and incorporation into regular program is to be decided on
Users´ needs Key users of statistical data (freight transport) rank missing information: 1. Content of containers 2. Transport chains (hinterland connections) 3. Transit with transhipment This information is important for • infrastructural planning • Expanding activities/ marketing • Modal shift programs
Data sources • Detailed information available from incoming maritime transport reported to CUSTOMS (Sagitta system, pre-arrival information) • Container identification numbers • Commodity description (free text field) • Railway companies • Container identification numbers • Barge information and communication system (BICS) (edifact based system) • Container identification numbers
Pilot project part A • Intention to link incoming maritime container transport with: • Inland waterways (BICS) • Railways statisticslinking based on: container number In order to model the MODAL SPLIT
A1. Railway statistics Project steps Develop method to link information based on the container numbers (micro approach) Use micro data to develop a model for transport links (macro approach) Produce output: transit with transhipment tables Advise whether standard output on regular base is feasible.
Current status First steps in linking micro data (maritime-railways) Problems with data quality: almost 50% of the container numbers misses the last digit (control digit). Customs data April 2007 linked to Railway data April and May 2007. Liking on container number and nearest date.
Results (1) 25% of the “railway” containers loaded in a maritime area could be linked to the “maritime” containers Problems with short distance traffic: Cycle is too short Empty containers: 98% intra EU-transport (UK, IE) First analyses concentrate onDEEP-SEA full container loads (FCL)
A2 Inland waterways (IWW) • Electronic Data from Barge Information and Communication system (BICS) are used (April and May 2007) • Data linked by container number • Problem: IWW journeys can reported more than once: result double counting
Example: Inland waterways • The ship xxxxx sails on 23-4-2007 from Rotterdam (NL) to Duisburg (DE). • It carries 114 containers. • Of which 20 empty and 94 loaded. • 79 of the loaded containers can be linked with maritime data (Customs data) by containernumber. • 58 containers are 20 ft and 21 containers are 40 ft (or more) • Total number of TEU (Twenty feet Equivalent Units) :58 + 21*2 = 100 TEU • Some containers have more than 1 shipment (total 101 shipments) • Total weight of the goods is 1437 tonnes • 8 different ship brokers provided the information to the customs • The containers were carried by 15 different sea vessels that called Rotterdam between 1 and 22 April 2007.
Future work Further development of linking algorithms Eliminating “false” linking Analysing representativety of linked data Setting up a model tot estimate the modal split
B. Commodities Most important user question in freight transport: What is inside the containers?
Facts: • Since the transit statistics have been stopped in the mid ’90ties, there is no information about the content of containers that are entering or leaving the Netherlands. • Trade statistics only describe import and export and not transit with transhipment.
Why now (1) • The container transport shows a yearly increase of 10% worldwide since 1995. • 25-30% of the goods unloaded in Rotterdam is containerised • Further growth is expected.: • on 5 September 2008 a new terminal in Rotterdam is opened with a capacity of 2,3 mln containers (TEU) per year. • Extension of the port of Rotterdam is started. Partly used for container terminals. • Exploitation of the new railway line “the Betuwelijn” heavily leans on container transport
Why now(2) Modal choice of the hinterland transport depends partly on the type of commodity. Political choices can better be founded if there is more knowledge about the commodities in containers. (“promotion of modal shift”)
Nothing!!(or by coincidence…) What do we know about the content of containers?
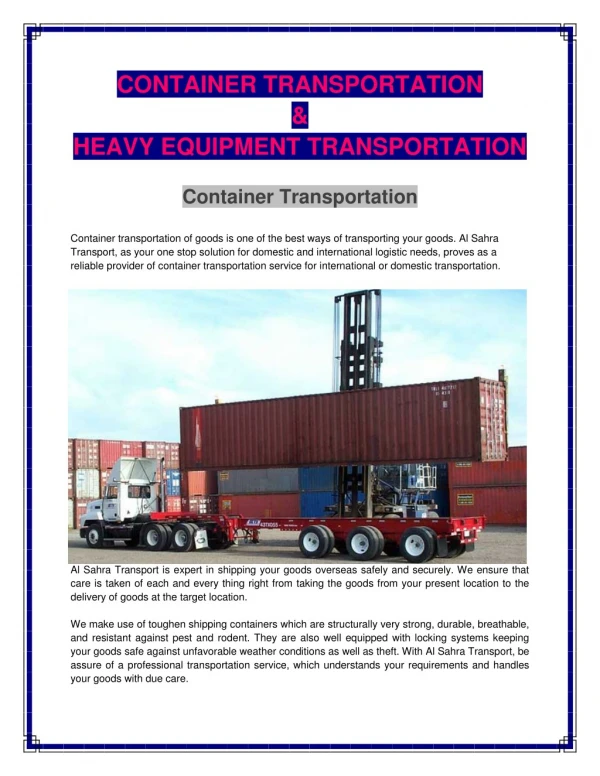
Beachcombing after an accident with Container ship Napoli, Jan 2007 40.000 bibles, printed in the Netherlands on its way to South-Africa
Why automatic coding of commodities ? • Data is or will be available in free-text format (electronically)( CUSTOMS pre-arrival system Sagitta for maritime and in soon also for aviation ) • Too much data to codify manually • Knowledge of data processing workers can be stored in rules and conversion tables (from “heads to tables”) • There fore:Pilot project to look for possibilities for automatic (automated) coding
Source : Customs • From the pre-arrival information of the Customs system SAGITTA the goods descriptions (free text format up to 255 chars) are selected. • Indication: 1.000.000 different descriptions /year • Numbers are growing because of - increasing number of ship-brokers that make use of the system - also data of outgoing container flow will be available
Basic principles • Coding system general applicable (independent from production system and modality) • Central processing • Fine tuned with parameters • Knowledge and rule based system. • Growing and extendible systemNot coding everything, but stop after a certain threshold • Drawing a sample from remainder, codify it manually and gross up.
Basic principles Automatic coded60-75% The aim is to codify automatically 60-75% of the goods automatically (representing 80-90 of the weight) Maximum Error: 1% Drawing a sample from remainder, codify it and gross up Remainder
Method automatic coding Decision rules - Using specific general available information (UN/HS) Algorithms • Full text search • Elimination of irrelevant information Databases • Knowledge tables • Coding table (from description to code) • List of non relevant words • Signature strings
Specific information : Signature strings • Free text field sometimes contains widely used information : - Dangerous goods codes (UN-number) - Harmonised system (HS-code) • Traceable codes using. SIGNATURE STRINGS, followed by a specific code Dangerous goods: U.N.NO.: UN# UNNR UN NUMBER: etc. Harmonised System (customs) HS CODE HS. NO. H.S.CODE NO. CUSTOMS COMMODITY CODE NO. etc.
Normalisation and codification • Deleting of irrelevant words and elements.. • Linking normalised description with codification table (most important table of the system)
Remaining (not coded) Sample of 10% from the not coded goods (about 3300 elements) Manually coding Imputation using the “random hot deck” method Automatic coded60-75% Remainder
14,7 15,9
Future developments • Decide on options: • Closing pilot and have data for just one month (April 2007) • Extending to one year and repeat it in 3 or 4 years • Incorporation in production process of maritime statistics • Cost benefit analysis of the options • Coding tables must be extended moreThis is very time consuming (expensive). • Improving sampling method • Enrichment of existing uni-modal statistics with commodity details (NSTR/NST2007) (Maritime, IWW, Rail)
Thank you for your attention • Questions or remarks? Peter Smeets Statistics Netherlands Division of Business Statistics Statistical Analysis Department Unit Traffic and Transport P.O. Box 4481 6401 CZ Heerlen, The Netherlands Phone +31 45 570 6432 E-mail: psts@cbs.nl