Download
1 / 18
180 likes | 312 Vues
Economies of Vertical Integration in the Swiss Electricity Sector. Presented by Sarah Noll. Background. New reforms have been passed to modernize the Swiss electricity sector.

E N D
Economies of Vertical Integration in the Swiss Electricity Sector Presented by Sarah Noll
Background • New reforms have been passed to modernize the Swiss electricity sector. • Legal (transmission and generation are separate legal entities) and functional (separate accounts and management for transmission and generation activities) unbundling of the utilities is required. • The intended result of unbundling the services into separate functions will allow for greater efficiency through stronger and more transparent competition in the generation and sale activities of this sector
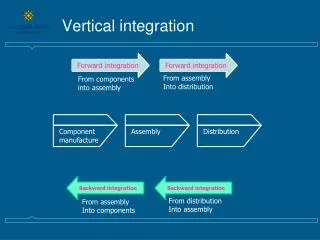
Vertical Integration • Unbundling reduces the chances of companies benefiting from vertical integration • Vertical Integration can be cost effective • Substantial need for coordination across stages • High transaction costs are associated with using intermediary markets
Model • A multi-stage cost function using two panel data econometric models were used: • A Generalized Least Squares (GLS) model with random intercept • A Random-Coefficients (RC) model
Model Specification • The cost function includes • Two outputs: electricity generation and distribution • Two inputs • Three output characteristic variables: customer density, load factor of the network and the capacity utilization factor at the generation level • A Linear time trend
Total Cost Function • C=C(Q1, Q2, PC, PL, CD, EC, LF, CU,T) • C= Total Costs • Q1= Electricity Generated • Q2= Electricity Distributed • PL=Input Factor Prices for Labor Services • PC= Input Factor Prices for Capital Services • CD= Customer Density • EC= Share of the Distributed Electricity to End Consumers • LF= Load Factor of the Network • T= Linear Time Trend Controlling for Technical Change.
Functional Form • Quadratic functional form • Unobserved heterogeneity • Readily adaptable to panel data econometric models • Relevant option for estimating scope economies • Accommodates zero values for outputs • Allows for the inclusion of specialized companies • Straight forward identification of economies of vertical integration. • Disadvantage: the linear homogeneity of the cost function in input prices cannot be imposed by parametric restrictions without sacrificing the flexibility of the functional form. • Solution: Normalization of prices- dividing the costs and all factor prices by one common factor price
Functional Form • Another option was to use a logarithmic function • However, with the vast number of zero’s logarithmic functions could result in large errors in the estimation of scope • Could mislead conclusion about economies of vertical integration
Normalized Quadratic Cost Function Specification The quadratic form is a flexible functional form with a second order Taylor approximation of any arbitrary function around a local approximation point. Cit=0 +Q1Q1it+ Q2Q2it + 1/2Q1Q1(Q1it)2 + 1/2Q2Q2(Q2it)2 + 1/2Q1Q2Q1it Q2it +PLPLit+ CDCDit + BCBCit + LFLFit + CUCUit+ TTt • Subscript “i” represents the company • Subscript “t” represents the year
Data • The data set contains financial and technical information from 74 companies • Covers a 9 year period from 1997-2005 • 36 companies are integrated with electricity distribution and hydropower generation • 9 companies are only electricity distributors • 29 companies are hydropower generators • This data set covers 42% of total electricity distribution and 40% of total hydropower generation in Switzerland
Results • Output and Input price coefficients are highly significant and have the expected positive sign. • Customer Density coefficient is negative • an increase in the customer density decreases costs • End Consumers coefficient is positive • Load Factor and Capacity Utilization Factor are negative • A higher peak load profile leads to higher costs, ceteris paribus • Time trend coefficient • GLS suggests a cost decrease in the electricity sector • RC shows the coefficient as not statistically significant • RC model shows the standard deviations are all statistically significant for the outputs and intercept • Significant variation in the output coefficients and the intercept across companies • There is a considerable unobserved firm-specific heterogeneity
Economies of Scale • The global economies of scale in a multi-output setting are defined as: C(Q1,Q2)- Total cost of producing Q1 & Q2 - Marginal cost of producing product Q1 - Marginal cost of producing product Q2
Economies of Scale Cont. • Global economies of scale describe the cost behavior caused by proportional changes in the entire production. • Economies of scale exist when ES>1 • Diseconomies of scale exist when ES<1
Product-Specific Economies of Scale • Based on changes of one output or an output pair • All other outputs are held constant – incremental cost resulting from producing output ()- costs of producing all the outputs jointly except output
Economies of Vertical Integration (EVI) • EVIs are present when costs can be reduced by joint production of multiple outputs across different production stages • The degree of EVI across two stages can be defined as the ratio of excess costs of separate production to the costs of joining production in one company
EVI • - Total cost when output for product Q2 is zero. • - Total cost when output for product Q1 is zero. • A positive value implies EVI • A negative value implies diseconomies of vertical integration.
Conclusions • Both GLS and RC estimates suggest the existence of EVI and scale economies across a major part of the sample. • The majority of companies in the analysis have less than 100,000 customers • These results apply mainly to small and middle-sized companies • RC model provides lower estimates of both economies • Gives a relatively lower weight to differences regarding fixed costs • No conclusive pattern suggesting one-sided bias • Table 4 confirms the presence of product-specific economies of scale
Conclusions Cont. • Additional costs could result from unbundling vertically integrated companies • Due to the significant economies of vertical integration and economies of scale that exist in a majority of the electricity companies • Results support the EU policy directive that allows for companies with fewer than 100,000 customers to be exempt from any functional unbundling requirement. • Unbundling processes reduce the possibilities to exploit the advantages of vertical integration