Download
1 / 1
20 likes | 141 Vues
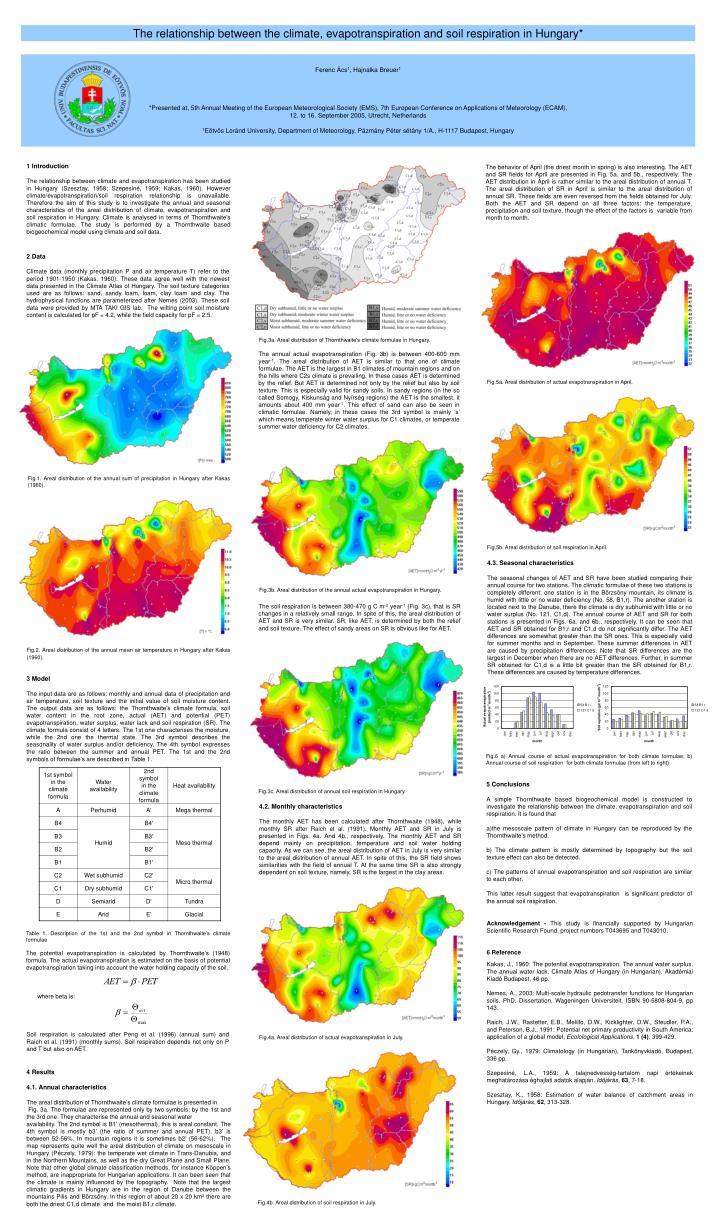
The relationship between the climate, evapotranspiration and soil respiration in Hungary*. Ferenc Ács 1 , Hajnalka Breuer 1

E N D
The relationship between the climate, evapotranspiration and soil respiration in Hungary* Ferenc Ács1, Hajnalka Breuer1 *Presented at, 5th Annual Meeting of the European Meteorological Society (EMS), 7th European Conference on Applications of Meteorology (ECAM),12. to 16. September 2005, Utrecht, Netherlands 1Eötvös Loránd University, Department of Meteorology, Pázmány Péter sétány 1/A., H-1117 Budapest, Hungary 1 Introduction The relationship between climate and evapotranspiration has been studied in Hungary (Szesztay, 1958; Szepesiné, 1959; Kakas, 1960). However climate/evapotranspiration/soil respiration relationship is unavailable. Therefore the aim of this study is to investigate the annual and seasonal characteristics of the areal distribution of climate, evapotranspiration and soil respiration in Hungary. Climate is analysed in terms of Thornthwaite’s climatic formulae. The study is performed by a Thornthwaite based biogeochemical model using climate and soil data. The behavior of April (the driest month in spring) is also interesting. The AET and SR fields for April are presented in Fig. 5a. and 5b., respectively. The AET distribution in April is rather similar to the areal distribution of annual T. The areal distribution of SR in April is similar to the areal distribution of annual SR. These fields are even reversed from the fields obtained for July. Both the AET and SR depend on all three factors: the temperature, precipitation and soil texture, though the effect of the factors is variable from month to month. 2 Data Climate data (monthly precipitation P and air temperature T) refer to the period 1901-1950 (Kakas, 1960). These data agree well with the newest data presented in the Climate Atlas of Hungary. The soil texture categories used are as follows: sand, sandy loam, loam, clay loam and clay. The hydrophysical functions are parameterized after Nemes (2003). These soil data were provided by MTA TAKI GIS lab. The wilting point soil moisture content is calculated for pF = 4.2, while the field capacity for pF = 2.5. Fig.3a. Areal distribution of Thornthwaite’s climate formulae in Hungary. The annual actual evapotranspiration (Fig. 3b) is between 400-600 mm year-1. The areal distribution of AET is similar to that one of climate formulae. The AET is the largest in B1 climates of mountain regions and on the hills where C2s climate is prevailing. In these cases AET is determined by the relief. But AET is determined not only by the relief but also by soil texture. This is especially valid for sandy soils. In sandy regions (in the so called Somogy, Kiskunság and Nyírség regions) the AET is the smallest, it amounts about 400 mm year-1. This effect of sand can also be seen in climatic formulae. Namely, in these cases the 3rd symbol is mainly ‘s’ which means temperate winter water surplus for C1 climates, or temperate summer water deficiency for C2 climates. Fig.5a. Areal distribution of actual evapotranspiration in April. Fig.1. Areal distribution of the annual sum of precipitation in Hungary afterKakas (1960). Fig.5b. Areal distribution of soil respiration in April. 4.3. Seasonal characteristics The seasonal changes of AET and SR have been studied comparing their annual course for two stations. The climatic formulae of these two stations is completely different: one station is in the Börzsöny mountain, its climate is humid with little or no water deficiency (No. 58, B1,r). The another station is located next to the Danube, there the climate is dry subhumid with little or no water surplus (No. 121, C1,d). The annual course of AET and SR for both stations is presented in Figs. 6a. and 6b., respectively. It can be seen that AET and SR obtained for B1,r and C1,d do not significantly differ. The AET differences are somewhat greater than the SR ones. This is especially valid for summer months and in September. These summer differences in AET are caused by precipitation differences. Note that SR differences are the largest in December when there are no AET differences. Further, in summer SR obtained for C1,d is a little bit greater than the SR obtained for B1,r. These differences are caused by temperature differences. Fig.3b. Areal distribution of the annual actual evapotranspiration in Hungary. The soil respiration is between 380-470 g C m-2 year-1 (Fig. 3c), that is SR changes in a relatively small range. In spite of this, the areal distribution of AET and SR is very similar. SR, like AET, is determined by both the relief and soil texture. The effect of sandy areas on SR is obvious like for AET. Fig.2. Areal distribution of the annual mean air temperature in Hungary after Kakas (1960). 3 Model The input data are as follows: monthly and annual data of precipitation and air temperature, soil texture and the initial value of soil moisture content. The output data are as follows: the Thornthwaite’s climate formula, soil water content in the root zone, actual (AET) and potential (PET) evapotranspiration, water surplus, water lack and soil respiration (SR). The climate formula consist of 4 letters. The 1st one characterises the moisture, while the 2nd one the thermal state. The 3rd symbol describes the seasonality of water surplus and/or deficiency. The 4th symbol expresses the ratio between the summer and annual PET. The 1st and the 2nd symbols of formulae’s are described in Table 1. Fig.6 a) Annual course of actual evapotranspiration for both climate formulae; b) Annual course of soil respiration for both climate formulae (from left to right) • 5 Conclusions • A simple Thornthwaite based biogeochemical model is constructed to investigate the relationship between the climate, evapotranspiration and soil respiration. It is found that • the mesoscale pattern of climate in Hungary can be reproduced by the Thornthwaite’s method. • b) The climate pattern is mostly determined by topography but the soil texture effect can also be detected. • c) The patterns of annual evapotranspiration and soil respiration are similar to each other. • This latter result suggest that evapotranspiration is significant predictor of the annual soil respiration. Fig.3c. Areal distribution of annual soil respiration in Hungary. 4.2. Monthly characteristics The monthly AET has been calculated after Thornthwaite (1948), while monthly SR after Raich et al. (1991). Monthly AET and SR in July is presented in Figs. 4a. And 4b., respectively. The monthly AET and SR depend mainly on precipitation, temperature and soil water holding capacity. As we can see, the areal distribution of AET in July is very similar to the areal distribution of annual AET. In spite of this, the SR field shows similarities with the field of annual T. At the same time SR is also strongly dependent on soil texture, namely, SR is the largest in the clay areas. Acknowledgement - This study is financially supported by Hungarian Scientific Research Found, project numbers T043695 and T043010. 6 Reference Kakas, J., 1960: The potential evapotranspiration. The annual water surplus. The annual water lack. Climate Atlas of Hungary (in Hungarian). Akadémiai Kiadó Budapest, 46 pp. Nemes, A., 2003: Multi-scale hydraulic pedotransfer functions for Hungarian soils. PhD. Dissertation, Wageningen Universiteit. ISBN 90-5808-804-9, pp 143. Raich, J.W., Rastetter, E.B., Melillo, D.W., Kicklighter, D.W., Steudler, P.A., and Peterson, B.J., 1991: Potential net primary productivity in South America: application of a global model, Ecolological Applications, 1 (4), 399-429. Péczely, Gy., 1979: Climatology (in Hungarian), Tankönyvkiadó, Budapest, 336 pp. Szepesiné, L.A., 1959: A talajnedvesség-tartalom napi értékeinek meghatározása éghajlati adatok alapján. Időjárás, 63, 7-18. Szesztay, K., 1958: Estimation of water balance of catchment areas in Hungary. Időjárás, 62, 313-328. Table 1. Description of the 1st and the 2nd symbol in Thornthwaite’s climate formulae The potential evapotranspiration is calculated by Thornthwaite’s (1948) formula. The actual evapotranspiration is estimated on the basis of potential evapotranspiration taking into account the water holding capacity of the soil. where beta is: Soil respiration is calculated after Peng et al. (1996) (annual sum) and Raich et al. (1991) (monthly sums). Soil respiration depends not only on P and T but also on AET. Fig.4a. Areal distribution of actual evapotranspiration in July. 4 Results 4.1. Annual characteristics The areal distribution of Thornthwaite’s climate formulae is presented in Fig. 3a. The formulae are represented only by two symbols: by the 1st and the 3rd one. They characterise the annual and seasonal water availability. The 2nd symbol is B1’ (mesothermal), this is areal constant. The 4th symbol is mostly b3’ (the ratio of summer and annual PET). b3’ is between 52-56%. In mountain regions it is sometimes b2’ (56-62%). The map represents quite well the areal distribution of climate on mesoscale in Hungary (Péczely, 1979): the temperate wet climate in Trans-Danubia, and in the Northern Mountains, as well as the dry Great Plane and Small Plane. Note that other global climate classification methods, for instance Köppen’s method, are inappropriate for Hungarian applications. It can been seen that the climate is mainly influenced by the topography. Note that the largest climatic gradients in Hungary are in the region of Danube between the mountains Pilis and Börzsöny. In this region of about 20 x 20 km2 there are both the driest C1,d climate and the moist B1,r climate. Fig.4b. Areal distribution of soil respiration in July.