Surface Area/Grain Size Relations
Surface Area/Grain Size Relations. Figure from Horowitz, 1991. Changes in Surface Area as a Function of Grain Size. Table from Horowitz, 1991; data from Jackson, 1979. Influence of Grain Mineralogy on Surface Area. Table from Horowitz, 1991; data fromForstner and Wittmann, 1981.

Surface Area/Grain Size Relations
E N D
Presentation Transcript
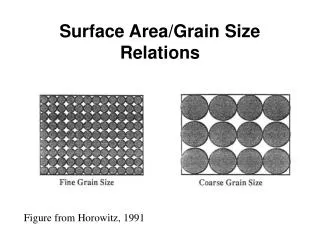
Surface Area/Grain Size Relations Figure from Horowitz, 1991
Changes in Surface Area as aFunction of Grain Size Table from Horowitz, 1991; data from Jackson, 1979
Influence of Grain Mineralogy on Surface Area Table from Horowitz, 1991; data fromForstner and Wittmann, 1981
Influence of Coatings on Surface Area • Sand-sized and Larger seds.: grain coatings composed of carbonates, Fe & Mn oxides and hydroxides, and organic matter are rough in comparison to surface of the underlying particles. • Coatings may comprise <5% by weight, but account for significant portion of the total surface area. • Silt and clays sized particles: coatings fill in surface irregularities. Also, cement grains together, creating larger agglomerated grains. Combination of processes reduces surface area. Based on Horowitz and Elrick, 1987
Surface Area vs. Concentration From Oliver, 1973
Grain Size vs. Concentration • Semi-systematic increase in concentration with finer-grained material • Decrease in conc. In finest fraction due to coatings, composition, and agglomeration of grains • Increase in fine sand due to dentrital minerals. Also to influx of metal enriched sediments from pollutant sources. Data from Forstner and Wittman, 1979
Grain Size vs. Concentration Data from Forstner and Wittman, 1979
Concentration vs. Quantity of Fine Sediment • Sizes Frequently Used • 16 μm • 62.5 μm • 63 μm • 125 μm Data from deGroot et al., 1982
Metals per unit Mass • Some deposits may contain so little fine-grained material that the bulk of the metal contaminant per unit mass is found in the sand-sized fraction.