Chapter 6 Process Selection and Facility Layout
Chapter 6 Process Selection and Facility Layout. What is designing a television? TV at RANGS Making sandwiches!. Deciding on the way production of goods or services will be organized

Chapter 6 Process Selection and Facility Layout
E N D
Presentation Transcript
Chapter 6Process Selection and Facility Layout What is designing a television? TV at RANGS Making sandwiches!
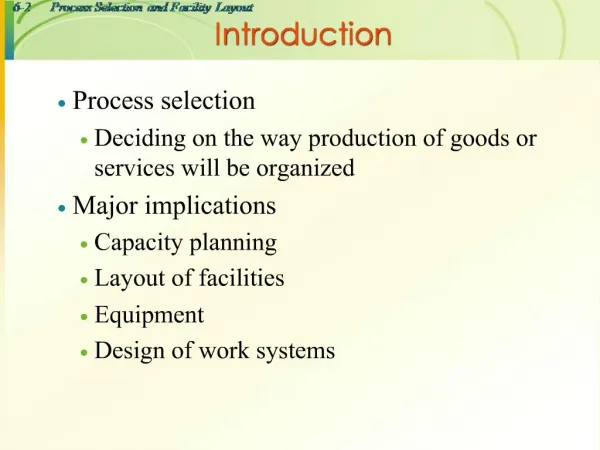
Deciding on the way production of goods or services will be organized A process is any part of an organization that transforms inputs into outputs, with the intention that the output will be of greater value than the input. Process selection
Process Selection and System Design- Figure 6.1 Forecasting Facilities andEquipment CapacityPlanning Layout Product andService Design ProcessSelection TechnologicalChange WorkDesign
Exam OM & Technology Competitive Advantage
Few Major Products, Higher Volume High Volume, High Standard- ization Low Volume One of a Kind Multiple Products, Low Volume Flexibility- Quality Job Shop Book Writing Batch Movie Theaters Assembly Line Automobile Assembly Continuous Flow Sugar Refinery Dependability- Cost Flexibility-Quality Dependability-Cost Product-Process Matrix
Linking key product or service requirements to process capabilities Product Profiling
Automation: Machinery that has sensing and control devices that enables it to operate • Fixed automation: Low production cost and high volume but with minimal variety and high changes cost • Assembly line • Programmable automation: Economically producing a wide variety of low volume products in small batches • Computer-aided design and manufacturing systems (CAD/CAM) • Numerically controlled (NC) machines / CNC • Industrial robots (arms)
Automation: Machinery that has sensing and control devices that enables it to operate … • Flexible automation: Require less changeover time and allow continuous operation of equipment and product variety • Manufacturing cell • Flexible manufacturing systems: Use of high automation to achieve repetitive process efficiency with job shop process • Automated retrieval and storage • Automated guided vehicles • Computer-integrated manufacturing (CIM)
Group of machines that include supervisory computer control, automatic material handling, robots and other processing equipment Advantage: reduce labor costs and more consistent quality lower capital investment and higher flexibility than hard automation relative quick changeover time Disadvantage used for a family of products and require longer planning and development times Flexible Manufacturing System
Use integrating computer system to link a broad range of manufacturing activities, including engineering design Purchasing order processing production planning and control … Advantage: rapid response to customer order and product change, reduce indirect labor cost, high quality Computer-integrated manufacturing
Establish boundaries Identify steps involved Prepare a flowchart Identify potential failure points Establish a time frame for operations Analyze profitability Service Process Design
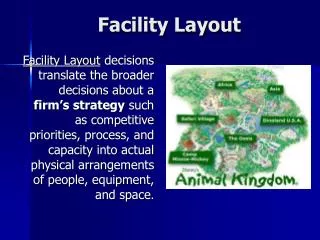
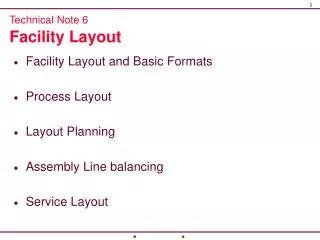
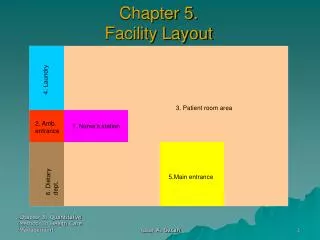
The configuration of departments, work centers, and equipment, with particular emphasis on movement of work (customers or materials) through the system Facilities Layout
Facilitate attainment of product or service quality Use workers and space efficiently Avoid bottlenecks Minimize unnecessary material handling costs Eliminate unnecessary movement of workers or materials Minimize production time or customer service time Design for safety Exam Objective of Layout Design
Inefficient operations Changes in the design of products or services For Example: High Cost Bottlenecks Accidents The introduction of newproducts or services Safety hazards The Need for Layout Decisions
Changes in environmental or other legal requirements Changes in volume of output or mix of products Morale problems Changes in methods and equipment The Need for Layout Decisions …
Exam Figure 6.4 | Product Layout Raw materials or customer Station 1 Station 2 Station 3 Station 4 Finished item Material and/or labor Material and/or labor Material and/or labor Material and/or labor Used for Repetitive or Continuous Processing
1 2 3 4 In 5 Workers 6 Out 10 9 8 7 A U-Shaped Production Line- Figure 6.6
Work Station 1 Work Station 2 Work Station 3 Exam Product Layout- sequential Figure 6.7 … Used for Repetitive Processing Repetitive or Continuous Processes
Dept. A Dept. C Dept. E Dept. B Dept. D Dept. F Exam Process Layout- functional Figure 6.7 Used for Intermittent processing Job Shop or Batch Processes
Process Layout Milling Assembly& Test Grinding Drilling Plating Process Layout - work travels to dedicated process centers
Layout in which the product or project remains stationary, and workers, materials, and equipment are moved as needed. Fixed Position Layouts
A Group of Parts Similar manufacturing characters
Group Technology Layout Similar to cellular layout Fixed Position Layout e.g. Shipbuilding Basic Layout Formats Part Family W Part Family X Part Family Z Assemble Y,W Assemble X,Z Part Family Y Final Product
Fixed-Position and combination Layout • Fixed-Position Layout: item being worked on remains stationary, and workers, materials and equipment are moved as needed. Example: buildings, dams, power plants • Combination Layouts: combination of three pure types. Example: hospital: process and fixed position.
Warehouse and storage layouts Retail layouts Office layouts Service layouts must be aesthetically pleasing as well as functional Service Layouts
Design Product Layouts: Line Balancing • Line Balancing is the process of assigning tasks to workstations in such a way that the workstations have approximately equal time requirements.
Determine Maximum Output Cycle time is the maximum time allowed at each workstation to complete its set of tasks on a unit.
Determine Maximum Output • Example: If a student can answer a multiple choice question in 2 minutes but gets a test with 30 questions and is given only 30 minutes then • OT=30 minutes; D=30 • Desired cycle time=1 minute < 2 minutes = Cycle time from the process capability
Determine the Minimum Number of Workstations Required: Efficiency • Example: Students can answer a multiple choice question in 2 minutes but given a test with 30 questions and is given only 30 minutes. What is the minimum number of students to collaborate to answer all the questions in the exam? • Total operation (task) time = 60 minutes = 30 x 2 minutes • Operating time=30 minutes • 60/3=2 students must collaborate. This Nmin below.
Calculate Percent Idle Time Efficiency = 1 – Percent idle time
0.1 min. 1.0 min. a b c d e 0.7 min. 0.5 min. 0.2 min. Precedence Diagram | Figure 6.11 • Precedence diagram: Tool used in line balancing to display elemental tasks and sequence requirements Exam
Example 1: Assembly Line Balancing • Arrange tasks shown in Figure 6.10 into three workstations. • Use a cycle time of 1.0 minute • Assign tasks in order of the most number of followers
0.1 min. 1.0 min. a b c d e 0.7 min. 0.5 min. 0.2 min. Example 1 Solution