IAGA Symposium A12.2
210 likes | 392 Vues
IAGA Symposium A12.2 Geomagnetic networks, computation and definition of products for space weather and space climate Melbourne, Australia, 2011. GLOBAL, REGIONAL AND LOCAL DYNAMICS OF STRONG GEOMAGNETIC STORMS.

IAGA Symposium A12.2
E N D
Presentation Transcript
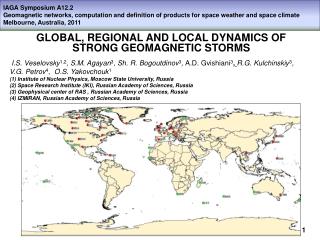
IAGA Symposium A12.2 Geomagnetic networks, computation and definition of products for space weather and space climate Melbourne, Australia, 2011 GLOBAL, REGIONAL AND LOCAL DYNAMICS OF STRONG GEOMAGNETIC STORMS I.S. Veselovsky1,2,S.M. Agayan3, Sh. R. Bogoutdinov3, A.D. Gvishiani3,R.G. Kulchinskiy3, V.G. Petrov4, O.S. Yakovchouk1 (1) Institute of Nuclear Physics, Moscow State University, Russia (2)Space Research Institute (IKI), Russian Academy of Sciences, Russia (3)Geophysical center of RAS , Russian Academy of Sciences, Russia (4)IZMIRAN, Russian Academy of Sciences, Russia 1
ABSTRACT • We analyze INTERMAGNET data about strongest geomagnetic storms observed during 23-rd solar cycle. • We compare this data set both statistically and individually with solar, heliospheric and magnetospheric conditions compiled in our data base APEV (http://dbserv.sinp.msu.ru/apev/fullist.htm) with the aim to investigate general and specific properties of the events, which demonstrate common features and broad diversity of situations. • New methods of analysis and dynamical visualization of big data sets related to geomagnetic storms are presented.
Scheme of Discrete Mathematical Analysis Fuzzy comparisons onpositive numbers Nearness in finite metrical space Limit in finite metrical space Density as measure of limitness Smooth time series. Equilibrium Monotonous time series Fuzzy logic and geometry on time series: geometry measures Separation of dense subset. Crystal. Monolith. Predicationof time series. Forecast Extremums on time series. Clusterization. Rodin Anomalies on time series. DRAS. FLARS. FCARS Convex time series Search of linear structure. Tracing 2
Logic of the interpreter Record Local level– building record rectification Global level– search of elevations on rectification 5
Local level building record rectification 6
Example of using FCARS algorithm on set of observatories Period: January 1-31 2005. Component X Hornsund (HRN) Abisko (ABK) Nurmijarvi (NUR) Surlari (SUR) Antananarivo (TAN) Port Alfred (CZT) 11
More detailed comparative investigation is performed for two events: CASE 1 Complicated geomagnetic storm (consisting of two parts) of November 8-11, 2004. CASE 2 Isolated Geomagnetic storm of May 15, 2005. Acknowledgement. We are grateful to Prof. Kalevi Mursula who provided his Dxt calculated indexes which represent corrected version of Dst.
CASE 1 Complicated Geomagnetic Storm of November 8-11, 2004 consisting of two parts • Heliospheric Current Sheet and Multiple Eruptions on the Sun. • Solar Wind and Interplanetary Magnetic Field. • Two coronal mass ejections. North-South magnetic field rotation during the flux rope crossings in the solar wind.
CASE 1: Part 1 - First Geomagnetic Storm Development (Equatorial Regions) .- Symmetry.- 08-Nov-2004 06:00:00 Dxt=- 372.823 nT
CASE 1: Part 2 - Second Geomagnetic Storm Development (Equatorial Regions) .- Asymmetry.- 10-Nov-2004 10:00:00 Dxt=- 264.491 nT
CASE 1: Heliospheric Current Sheet and Multiple Eruptions on the Sun
CASE 1: Dynamic analysis using DMA approach and GIS technology
CASE 2: Isolated Geomagnetic storm of May 15, 2005 - Geomagnetic Storm Development (Equatorial Regions) .- Symmetry.- 15-May-2005 08:00:00 Dxt=- 243.836 nT
CASE 2: Heliospheric Current Sheet and Multiple Eruptions on the Sun
CASE 2: Dynamic analysis using DMA approach and GIS technology
CASE 2 Time delay • The main ring current started to develop with a large delay (~3 hours) after the interplanetary shock arrival to the Earth and the sudden commencement. • It is because of the interplanetary electric field unfavorable orientation against the magnetosphere (positive Bz).
What do we see on the Equator? • Case 1. Strongly delayed (half a day!) irregular evelopment. Longitudinal asymmetry. Storm like a Substorm. Similar case – Carrington Event (September 1859) • Case 2. Nearly simultaneous storm development on the globe. Longitudinal symmetry. Ring current . Dst or Dxt.
Conclusion 1 • The ring current is not always a main contributor to the equatorial geomagnetic perturbations during the development and the main phase of strong geomagnetic storms.
CONCLUSIONS • Global, regional and local properties of individual geomagnetic storms have common and specific features depending on the driving external conditions in the heliosphere and on the Sun. • Based on our analysis we conclude that geomagnetic proxies could serve as an important source of indirect information about solar and heliospheric activity in the past, when direct observations were not available. • Reliability and accuracy of physical interpretations and models essentially depend on the quality of geomagnetic input information and assumed conditions on the ground, in the ionosphere, the magnetosphere, the solar wind and on the Sun. • Well calibrated INTERMAGNET data in combination with other ground based measurements and multipoint satellite missions are promising for the future progress towards better and broader scientific and technical use of geomagnetic information. • Suggestedannewapproach to analysisofgeomagneticeventsbasedondatafromtheglobalnetworkofIntermagnetobservatories using fuzzy mathematics and GIS technology. • Thank you!