Download
1 / 32
350 likes | 508 Vues
CRITICAL EVALUATION OF EDUCATIONAL RESEARCH . Introduction Quantitative Research Qualitative Research Quiz. CRITICAL EVALUATION OF EDUCATIONAL RESEARCH . Introduction (today) Quantitative Research (not today) Qualitative Research (also not today)

E N D
CRITICAL EVALUATION OF EDUCATIONAL RESEARCH • Introduction • Quantitative Research • Qualitative Research • Quiz
CRITICAL EVALUATION OF EDUCATIONAL RESEARCH • Introduction (today) • Quantitative Research (not today) • Qualitative Research (also not today) • Quiz (not even the next day, but the one after that)
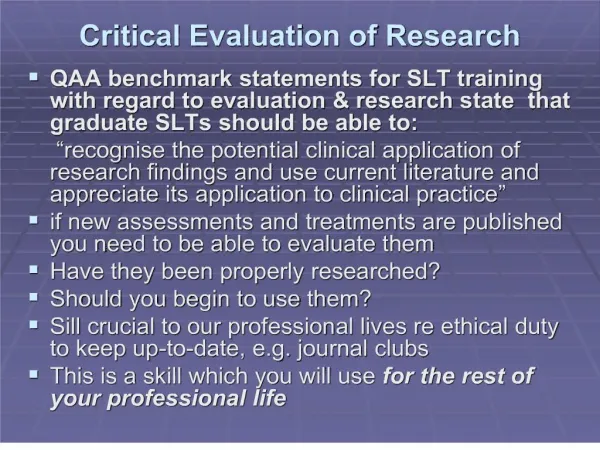
Why is it important to learn to critically evaluate educational research? • To help assess the effectiveness of new (and old) educational practices; • To distinguish between well-designed and poorly designed research studies; • To participate in / evaluate data-based decision-making (those that have the data control the agenda). Has anyone done any research?
QuantitativeResearch analysis of numerical data representing experience QualitativeResearch analysis of data such as words, pictures, or objects representing experiences Now picture this….
Who doesn’t like a good math story problem now and then? 17. A clear, octagonal tank measures 29.9 cm across, has sides of length 12.4 cm and is 36.5 cm tall. It is being filled with water at the rate of 16 ounces every 8.5 seconds. Assume that this rate does not vary over the course of the filling process. How long will it take to fill the tank?
Dan Meyer says: 1. Use multimedia; 2. Encourage student intuition; 3. Ask the shortest question you can; 4. Let students build the problem; 5. Be less helpful. (Design a sequel.) Is Dan Right?
Be a wise consumer of educational research…. Deliberate/Non-Deliberate Bias or Distortion of Research U.S. Department of Education Official: "A 3-year-old child in an affluent family has a larger working vocabulary than the mother of a 3-year-old from a welfare family." Google That! http://people.ischool.berkeley.edu/~nunberg/vocabulary.html Some of the following slides are adapted from a presentation by Dr. J. Anderson.
Actual research finding: “When 3 year olds of professional mothers talk to their mothers, they use more words than do mothers on welfare when talking to their own 3 year olds. Welfare mothers use far larger vocabularies when talking to their friends, their older children, or the researchers themselves.” Hare, B. & Risley, T. (1995). Meaningful differences. Baltimore; Paul H. Brookes.
Research Question The research question determines the focus of a research study. The remainder of the study is a systematic process of obtaining an answer to that question. The purpose of the research question is to tell the reader the intent of the study and set the stage for what follows. Nuts & Bolts
Examples: • Do boys and girls in coed and same-sex classes differ in regard to their perceptions of student behavior, teacher support, and competitiveness? • Is there an association between high school grades and study time? • What is the impact of playing classical music in the classroom on students’ academic achievement in mathematics?
Research Hypothesis • The research hypothesis is a predictive statement about the expected outcome of the research • The research hypothesis dictates the method and design of the research and gives the reader an idea of what the design should look like. Nuts & Bolts
Example: “Children who attend preschool will make greater gains in first grade reading achievement than comparable children who do not attend preschool.” “Students whose teachers maintain a blog focused on their professional practice will show greater gains on the HSPE than students whose teachers do not.”
The Independent Variable is the presumed cause of some educational phenomena The Dependent Variable is the presumed effect of some educational phenomena Nuts & Bolts
Examples • State mandated testing of all students will have a negative effect on teacher morale. • High teacher morale results in lower teacher absenteeism than low teacher morale. • Having the teacher shake hands with each student as they enter the classroom will increase student active participation in class discussion.
Experimental Group Group that receives the independent (treatment) variable Control Group (Comparison) Has the same characteristics as the experimental group but does not experience the independent variable. Sample Portion of a population that is included in the study. Population Total number of people or things from which a smaller sample is drawn. Nuts & Bolts
Measures of Central Tendency Mean (M) This is an average but we think of it as “the” average. It is calculated by dividing the sum of the scores by the number of scores. Median The middle score in a distribution of scores. Mode The most frequently occurring score in the distribution. Nuts & Bolts
Measures of Variability or Spread Standard Deviation (SD) Is a measure of the extent to which, scores in a distribution, on the average, deviate from their mean. How “spread out” are the data? Range Is the distance between the lowest and highest scores in a distribution. A normal distribution Nuts & Bolts
Statistical Significance A statistical test (T test, chi square, ANOVA) may be conducted to determine the probability that the difference between mean scores of two groups can be attributed to chance. Probability value = p Traditional levels of significance .05, .01, .001 ns = not significant Nuts & Bolts
Statistical Significance Don’t confuse the level of significance (p value) with the practical educational significance of the research results. The level of significance is strongly influenced by the number of individuals (n) included in the research project. 1,000 subjects; M1=42, M2=45 p<.01 50 subjects; M1=42, M2=50 ns Nuts & Bolts
K. p<.012 L. p<.367 p<.10 p<.100 p<.051 p<.067 p<.041 p<.35 p<.20 p<.01 p<.05 p<.080 p<.001 p<.024 p<.17 p<.111 p<.283 p<.83 Which p values indicate that the observed differences will occur by chance ≤5% of the time? Less than 1% of the time?
Group AGroup B Pre 38 Pre 34 Post 43 Post 42 p<.05 p<.01 True or False: It is more likely that the difference between the mean pre and post test scores of Group A is due to chance than it is that the difference between the mean pre and post test scores of Group B is due to chance.
Validity Refers to the degree to which your observations actually measure what they purport to measure. Example: I want to measure the quality of an 8th grade teacher’s work. Is the mean MSP score for the class a valid measure? Nuts & Bolts
Reliability Refers to the repeatability of scientific observations. A measure is reliable if it produces similar results under consistent conditions. Example: The mass of a text book may be measured with great reliability. Measurement of 8th graders’ proficiency with division of fractions may be less reliable. Nuts & Bolts
Generalizability Refers to the applicability of research findings to settings and contexts different from the one in which they were obtained. Example: If a study is done with 2nd graders in an urban school district (n=245), can you infer that the study’s conclusions will apply in your district with your 2nd graders? Nuts & Bolts
Finally, A good research document empowers readers to reach their own conclusions by including: • A well-defined question; • Description of the context and existing information about an issue; • Consideration of various perspectives; • Presentation of evidence, with data and analysis in a format that can be replicated by others; • Discussion of critical assumptions, contrary findings, and alternative interpretations; • Cautious conclusions and discussion of their implications; • Adequate references, including original sources, alternative perspectives, and criticism. Evaluating Research Quality: Guidelines for Scholarship (2012) Todd Litman - Victoria Transport Policy Institute
And really finally, a negative exemplar… Bad Research (Please consume research responsibly.)
The Dangers of Bread http://www.geoffmetcalf.com/bread.html
The Dangers of Bread “A recent headline read, ‘Smell of baked bread may be health hazard.’The article described the dangers of harmful air emissions from baking bread. I was concerned. When are we going to do something about bread-induced pollution? We reigned in tobacco companies, but when is the government going to go after Big Bread? Well, I’ve done a little research, and what I’ve discovered should make anyone think twice...”
1. More than 98% of convicted felons are bread eaters. 2. Fully half of all children who grow up in bread-consuming households score below average on standardized tests. 3. More than 90% of violent crimes are committed within 24 hours of eating bread. • Bread is made from a substance called “dough.” It has been proven that as little as one pound of dough can suffocate a mouse. 8. Primitive tribal societies that have no bread exhibit a low occurrence of cancer, Alzheimer’s, Parkinson’s disease and osteoporosis. -8. Bread is baked at temperatures as high as 400o F! That kind of heat can kill an adult in less than one minute.