Download
1 / 1
10 likes | 219 Vues
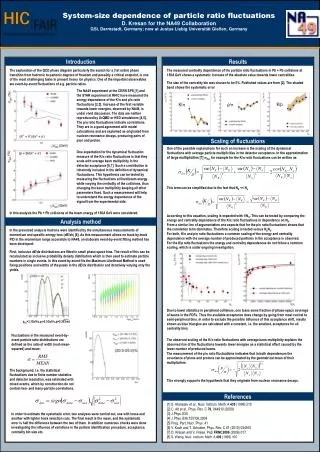
System-size dependence of particle ratio fluctuations D. Kresan for the NA49 Collaboration GSI, Darmstadt, Germany ; now at Justus Liebig Universität Gießen, Germany. Introduction. Results.

E N D
System-size dependence of particle ratio fluctuations D. Kresan for the NA49 CollaborationGSI, Darmstadt, Germany; now at Justus Liebig Universität Gießen, Germany Introduction Results The exploration of the QCD phase diagram particularly the search for a (1st order) phase transition from hadronic to partonic degrees of freedom and possibly a critical endpoint, is one of the most challenging tasks in present heavy ion physics. One of the important observables are event-by-event fluctuations of e.g. particle ratios. The measured centrality dependence of the particle ratio fluctuations in Pb + Pb collisions at 158A GeV shows a systematic increase of the absolute value towards lower centralities. The size of the centrality bin was chosen to be 5%. Published values are from [2]. The shaded band shows the systematic error The NA49 experiment at the CERN SPS [1] and the STAR experiment at RHIC have measured the energy dependence of the K/ and p/ ratio fluctuations [2,3]. Increase of the first variable towards lower energies, observed by NA49, is under vivid discussion. The data are neither reproduced by UrQMD or HSD simulations [4,5]. The p/ ratio fluctuations indicate correlations. They are in a good agreement with model calculations and are explained as originated from nucleon resonance decays, producing pairs of pion and proton. K/ p/ K/p Scaling of fluctuations One of the possible explanations for such an increase is the scaling of the dynamical fluctuations with average particle multiplicities in the detector acceptance. In the approximation of large multiplicities [7]dyn for example for the K/ ratio fluctuations can be written as: One expectation for the dynamical fluctuation measure of the K/ ratio fluctuations is that they scale with average kaon multiplicity in the detector acceptance [6,7]. Such a contribution is inherently included in the definition of dynamical fluctuations. This hypothesis can be tested by measuring the fluctuations at fixed beam energy while varying the centrality of the collisions, thus changing the kaon multiplicity keeping all other parameters fixed. Such a measurement will help to understand the energy dependence of the signal from the experimental side. This term can be simplified due to the fact that NK << N In this analysis the Pb + Pb collisions at the beam energy of 158A GeV were considered. According to this equation, scaling is expected with 1/NK. This can be tested by comparing the energy and centrality dependence of the K/ ratio fluctuations in dependence on NK. From a similar line of argumentation one expects that for the p/ ratio fluctuations shows that the correlation term dominates. Therefore scaling is tested versus NpN. For both, K/ and p/ ratio fluctuations a common scaling of the energy and centrality dependence with the average number of produced particles in the acceptance is observed. For the K/p ratio fluctuations the energy and centrality dependences do not follow a common scaling, which is under ongoing investigation. Analysis method In the presented analysis hadrons were identified by the simultaneous measurements of momentum and specific energy loss (dE/dx) [8]. As this measurement allows no track-by-track PID in the momentum range accessible to NA49, an elaborate event-by-event fitting method has been developed: First, inclusive dE/dx distributions are fitted in small phase space bins. The result of this can be recalculated as inclusive probability density distribution which is then used to estimate particle numbers in single events. In this event-by-event fits the Maximum Likelihood Method is used fixing positions and widths of the peaks in the dE/dx distribution and iteratively varying only the yields. Due to lower statistics in peripheral collisions, one loses some fraction of phase-space coverage of kaons in the PDFs. Thus the available acceptance does change by going from most central to semi-peripheral bins. In order to exclude the possible influence of this acceptance shift, results shown as blue triangles are calculated with a constant, i.e. the smallest, acceptance for all centrality bins. ptot=3.3GeV/c,pt=0.3GeV/c,=0.393rad Fluctuations in the measured event-by-event particle ratio distributions are defined as the ratio of width (root-mean-squared) and mean: The observed scaling of the K/ ratio fluctuations with average kaon multiplicity explains the observed rise of the fluctuations towards lower energies as a statistical effect caused by the lower number of produced kaons. The measurement of the p/ ratio fluctuationsindicates that in both dependences the covariance of pions and protons can be approximated by the geometrical mean of their multiplicities: This strongly supports the hypothesis that they originate from nucleon resonance decays. The background, i.e. the statistical fluctuations due to finite number statistics and detector resolution, was estimated with mixed events, which by construction do not contain two- and many-particle correlations. References [1] S. Afanasev et al., Nucl. Instrum. Meth. A 430 (1999) 210 [2] C. Alt et al., Phys. Rev. C 79, 044910 (2009) [3] J.Phys.G35 [4] J.Phys.G36:125106,2009 [5] Prog. Part. Nucl. Phys. 41 [6] V. Koch and T. Schuster, Phys. Rev. C 81 (2010) 034910 [7] D. Kresan and V. Friese, PoS FRNC2006 (2006) 017 [8] S. Wenig, Nucl. Instrum. Meth. A 409 (1998) 100 In order to estimate the systematic error, two analyses were carried out, one with loose and another with tighter track selection cuts. The final result is the mean, and the systematic error is half the difference between the two of them. In addition numerous checks were done investigating the influence of variations in the particle identification procedure, acceptance, centrality bin size etc.