Modèle de Kano
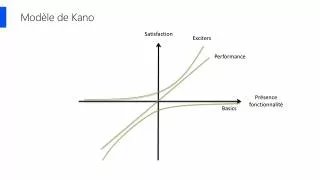
Modèle de Kano. Satisfaction. Exciters. Performance. Présence fonctionnalité. Basics. Le processus de responsabilité. Responsibility Obligation Shame Justify Lay Blame Denial. Quit. Source: Christophe Avery, conseiller sur le leadership responsible et le travail de groupe.

Modèle de Kano
E N D
Presentation Transcript
Modèle de Kano Satisfaction Exciters Performance Présencefonctionnalité Basics
Le processus de responsabilité Responsibility Obligation Shame Justify Lay Blame Denial Quit Source: Christophe Avery, conseillersur le leadership responsible et le travail de groupe
Innovation Rate Building new vs. sustaining existing What percentage of your product is spent on building new functionality vs. maintaining the existing vs. expanding capacity?
Innovation Rate Which is better ?
Strategic Alignment Index Software to support strategic vision and IT strategy High Highest benefits are most likely realized when building these products or features Business Strategic Alignment = Product Size of Bubble = TCO Low IT Strategic Alignment Low High
Strategic Alignment Index High Highest benefits are most likely realized when building these products or features Business Strategic Alignment = Product So why do these get built ? Size of Bubble = TCO TCO (Total Cost of Ownership) and alignment are some variables that can be used in backlog ordering Low IT Strategic Alignment Low High
On-Product Index Making sure team can deliver Percent of time team spends working on product stuff (eg. Things that create value) Generally, higher is better
Task switching destroys efficiency and quality, and can actually make you less intelligent Source: Gerald Weinberg, Quality Software Management : System Thinking
Product Availability Customer access, usability, and support
Usage Index Do people actually use the functionality you build ? Build things that people will actually use. If they aren’t, try to figure out why and drive more usage. If you can’t, why do you have the feature ? Higher tends to bebetter
Installed Version Index Monitoring product absorption What percent of your customers are on your latest (n) release ?
Any KPI by itself provides very little information.KPIs are all interconnected
Using KPIs provides a high-level proxy of actual value delivered by software products $1