Download
1 / 21
210 likes | 232 Vues
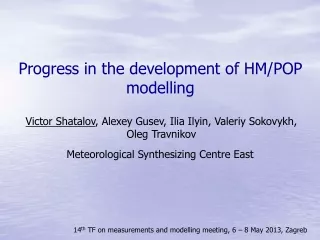
Study on the effectiveness of Heavy Metals (HM) and Persistent Organic Pollutants (POP) Protocols, including project structure, progress, difficulties, and future suggestions. Phases I and II analyze emission reductions and costs involved, with projections for 2010-2020 and country-specific data. Recommendations for protocol revision options, implementation strategies, and consensus-building are provided.

E N D
Task Force on Persistent Organic Pollutants Meeting 1-3 March 2004 A study to the effectiveness of the HM and POP Protocols and costs of additional measures Hugo Denier van der Gon & Antoon Visschedijk Commissioned by the Netherlands Ministry of Housing, Spatial Planning and Environment, contact persons Ton Blom and Johan Sliggers
Contents • Structure of the project • What, how & when • Current progress • Illustrate some of the difficulties with examples • Discussion & suggestions Effectiveness of HM and POP Protocols
Study comprises two phases: • Phase I • Emission reduction due to implementation of the HM/POP Protocols • Reduction option +costs • 12 months, January 2004 – December 2004 • Go / No Go • Phase II • Emission reduction and costs of options to revise the HM/POP Protocols • 6 months, after phase I (earliest January 2005) Effectiveness of HM and POP Protocols
Reference inventory for Europe, 1990 and 2000 Projection 2010, 2015 and 2020 Autonomous measures + In-country measures Projection 2010, 2015 and 2020 Autonomous measures + Full implementation Protocols Difference Phase I:Emission reduction due to implementation of the HM/POP Protocols Non-ratified Ratified + non-ratified Effectiveness of HM and POP Protocols
Reference inventory for Europe, 1990 and 2000 • All European UNECE Member States • Heavy Metals (Pb, Cd, Hg + 6 additional) • POPs + Substances possibly proposed to be added to POP Protocol • Country data submissions to EMEP and UNECE • 1990 and 2000 default TNO data to fill ‘gaps’ • Consistency check • Country comments • Production of gridded emissions for modelling purposes Effectiveness of HM and POP Protocols
HM and POP in this study a) Three HM (Cd, Pb, Hg) addressed by the protocol in bold, the other 6 HM are also included since their emissions are often simultaneously reduced as a consequence of reduction measures for the three priority HM. b) POP named in the POP protocol in bold, other POP are substances that may be proposed to be added to the POP protocol in the future. Effectiveness of HM and POP Protocols
Projections for 2010, 2015 and 2020 • Activity scenarios 2010, 2015 and 2020 (conform IIASA & CAFE): • Energy use (including transport) • Physical industrial production • Agricultural production • Waste generation • All foreseen reduction policies for 2010, 2015 and 2020: • UNECE Protocols for other substances (e.g. Sulphur) • IPPC Directive in EU • Other EU Directives (e.g. LCP, Waste) • National policies • HM / POP Protocols: • Implementation for countries that have ratified • Countries that have not ratified: • All foreseen but No implementation (Projection I) • Full implementation (Projection II) Effectiveness of HM and POP Protocols
Phase I will provide: • Overview of HM / POP emissions in Europe, by country, by source • HM / POP Emission forecasts for 2010, 2015 and 2020 • Side effects on other substances (e.g. PM10, PM2.5) • An estimate of the incremental effect of complete (all countries) implementation of HM / POP Protocols • Additional effort: • A list of options for possible revision of the HM / POP Protocols • Based on remaining source contributions • Including preliminary estimates for costs and reduction potential • List to be submitted to Task Force POP and Expert Group HM Effectiveness of HM and POP Protocols
Phase II: Emission reduction and cost of options to revise the HM/POP Protocols • Phase II will start when Phase I is completed ( earliest 1-1-2005) • Starting points are: • Full implementation of HM / POP Protocols • Options proposed by TF POP and EG HM: • Measures for the HM & POP already in protocols • Measures for substances scheduled for review • Measures for substances proposed for possible addition • Avoided emission by country, by measure for 2010, 2015 and 2020 • Annual costs by country, by measure for 2010, 2015 and 2020 • Side effects on other substances included (6 HM , PM10) Effectiveness of HM and POP Protocols
The project overall • Results of the study (Phase I and Phase II) to be made available at early stage to: • Country experts • Task Force on POP • Expert Group on Heavy Metals • IIASA, ECTEI, EMEP, MSC EAST, TFEIP and TCAQCC • Project aims at consensus on emission data • Four reports in total: • Phase I, HM • Phase I, POP • Phase II, HM • Phase II, POP • Gridded emission data available for modelling Effectiveness of HM and POP Protocols
Current progress / status I • Building reference database for 1990 & 2000 • Necessary to distribute national totals to activities and identify reduction options & costs • Most effort on 2000 as this is needed for projections and we have a good start for 1990 Effectiveness of HM and POP Protocols
Current progress / status II • Derive the official reported data and check for missing data and consistency • Introduction of project to countries through national focal points • Introduction Letter is accompanied by • overview of reported data and • enquiry for missing data • and/or elucidating data inconsistencies. Inter-country comparison, trend 1990-2000, different reportings Effectiveness of HM and POP Protocols
Stepwise identification of caveats in HM & POP emission inventory • Official reporting (EMEP, webdab): all substances reported by a country in any year count as an indicator for country information (e.g., 1995 data can be scaled to 2000). Result is list of missing substances by country • Incorporate other official UNECE document information (e.g. replacing NE with zero if countries have indicated zero use & production • Bring in emission data from 1997 UBA/TNO study – for countries where emissions where zero at the time, they will be considered still zero. • EMEP expert estimates to fill gaps in list of missing substances by country under (1). Result is reduced list of missing substances by country. Note: EMEP expert estimates may be under discussion later but indicate good default start information • Scan UNECE dossier information, Scan MSC-E reports, Result is reduced list of missing substances by country • Filling of caveats by TNO from other sources. (e.g., POP possibly to be added) Result is national total emissions by substance by country for 2000. A split over sectors and activities is next step (if not available from original sources) Effectiveness of HM and POP Protocols
What have we got so far? For 44 countries during 1990-2000 based on stepwise filling (on-going) Questionnaire interpretation sometimes tricky (NE or NO, etc.) Biggest problems are dioxines, HCB, HCH, PCBs & PAHs Effectiveness of HM and POP Protocols
Difficulties & Apparent inconsistencies in reporting : How reliable? Extremes influence mitigation costs Therefore, careful check if need be, use expert estimate instead of official data Source: Officially Reported Emission Data (EMEP WEBDAB, Feb. 2004) Effectiveness of HM and POP Protocols
Check for trend consistency not only in 1990 and 2000. Source : Officially Reported Emission Data http://webdab.emep.int/ 25 February 2004 Effectiveness of HM and POP Protocols
And for different reporting formats! Source : Officially Reported Emission Data http://webdab.emep.int/25 February 2004 Effectiveness of HM and POP Protocols
PAHs in the Netherlands, t/y PCDD/Fs in Denmark, g/TEQ/y & outlier Country reportings over time Source: Modelling assessment of uncertainties of HM and POP emission inventories(S. Dutchak et al., 2003) Based on Official emission data (document “Present state of emission data”, EB.AIR/GE.1/2002/8, table 9 ) Effectiveness of HM and POP Protocols
EMEP expert estimates – a valuable addition? Yes, for general confirmation but especially if underlying data are available Effectiveness of HM and POP Protocols
Possible newly added substances Special effort necessary in making emission inventories (1990, 2000), projections & gridding because • limited information • No country reporting (yet) • Use the dossiers available at UNECE site • Just starting; any suggestions for further data welcome • For the “pesticide & industrial product” substances could we get more country information? (registered, produced, (not) allowed etc.) • Emission measurement data? Effectiveness of HM and POP Protocols
Final remarks • Thus a slight delay (2-3 weeks) in sending out the introduction letter because we want to document problems & ask for clarification • All information & suggestions welcome especially for possibly new substances • Pesticide POPs & industrial produced POPs we hope for more country information (legislation, production) • It would be helpful if we have access to EMEP expert estimates at the highest detail (underlying data) • ? Effectiveness of HM and POP Protocols