Stream Sampling for Benthic Macroinvertebrates
Presented By: Grant De Jong. Stream Sampling for Benthic Macroinvertebrates. What are the bugs telling us? And who understands them?. Rocky Mountain Water Quality Analysts Association 2014 Annual Symposium April 25, 2014. “Benthic Macroinvertebrates”? “Bugs”?. This? This? Heteroptera?

Stream Sampling for Benthic Macroinvertebrates
E N D
Presentation Transcript
Presented By: Grant De Jong Stream Sampling for Benthic Macroinvertebrates What are the bugs telling us? And who understands them? Rocky Mountain Water Quality Analysts Association 2014 Annual Symposium April 25, 2014
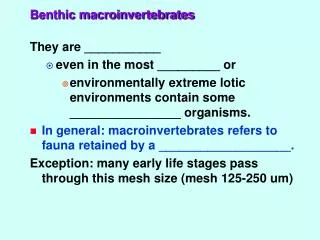
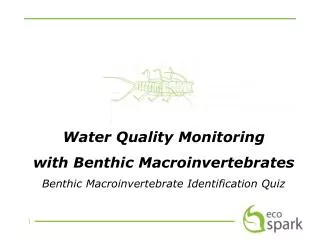
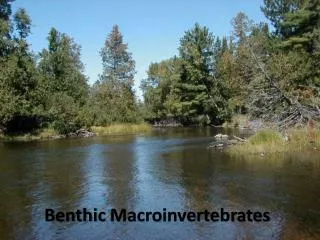
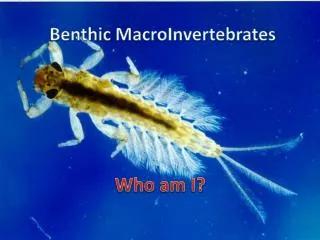
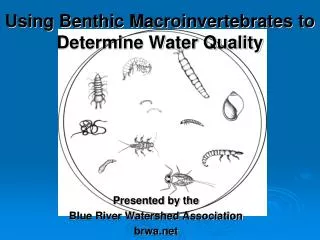
“Benthic Macroinvertebrates”?“Bugs”? • This? • This? • Heteroptera? • An aquatic, multicellular animal without a backbone and large enough to be seen with the naked eye.
Kick Net (qualitative, or,at best, semi-quantitative) • This is the “kick net” some people use • This is the kick net I prefer to use • Use it to sample habitat other than riffles
Qualitative – presence/absence, maybe some relative abundance • Gives us a “Who’s there” approach • Not generally amenable to statistical analysis • Quantitative – numbers • Usually reported in #/m2 • Replication • Gives us ability to run statistics • ANOVA, t-tests, etc.
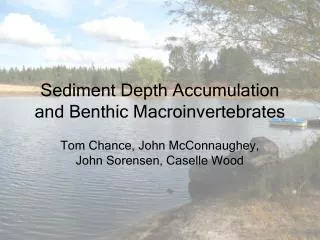
Hess sampler • Originally designed for use in soft-bottom streams in the East. • Steve Canton and Jim Chadwick modified it for the cobble-bottom streams of Colorado and the West.
Colorado State Protocol • Uses a semi-quantitative approach: • 1 kick net sample in 1 m² of riffle habitat over 60 seconds • Since this was done at 100’s of sites, the data can be used in a regional approach • Individual sites can be compared to the region, but not to each other
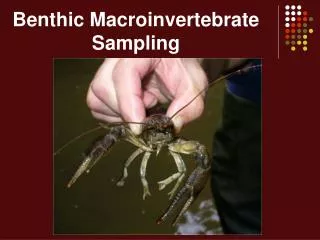
Step 2: Lab work • Samples come to the lab filled with • Sticks • Stones • Grass • Algae • Mud • Sand • Unidentifiable plastic stuff • and Bugs! • Someone gets to sort the bugs from all that debris.
and then identify all those bugs and count them.
Invertebrate Taxonomy • Bugs from the samples are identified – usually to the genus or species level. • Quality assurance on IDs and counts – 95% is pass level • Report lists all of the taxa and their counts for each replicate at each site.
Final Bug Report INSECTA EPHEMEROPTERA Baetis bicaudatus Paraleptophlebia sp. Timpanoga hecuba ODONATA Archilestes sp. Enallagma sp. PLECOPTERA Cultus aestivalis Doroneuria baumanni Skwala paralella Sweltsa sp. COLEOPTERA Agabus sp. TRICHOPTERA Arctopsyche grandis Hesperophylax sp. Hydropsyche sp. Rhyacophila brunnea/vao DIPTERA Ceratopogoninae Neoplasta sp. Simulium sp. CRUSTACEA AMPHIPODA Hyalella aztecacx. MOLLUSCA PELECYPODA Dreissena polymorpha
Final Bug Report • Several metrics automatically calculated on a replicate basis (therefore, we can use them for statistical analysis) • Total density • Number of taxa • Number of EPT taxa • EPT Index • Ephemeroptera Abundance • Some metrics calculated based on composite of replicates • All above metrics • Shannon-Weaver Diversity Index • Additional metrics
Translating the Data • Our “Universal Translator” – takes bug names and translates them into ecological entities • BUGSWITH, GEI’s in-house, proprietary system in Excel for managing invertebrate data • Benthic Invert Taxa List • Data Entry/Report Production Worksheets • Taxon Characterization Worksheet • Metric Calculation Worksheet • List of Taxonomic Literature • Data can be used to calculate Colorado Multimetric Index (MMI)
Benthic Invert Taxa List - the “backbone” of the system • List of 12,337 invertebrate taxa (1 January 2014) • Started with <2,000 taxa, using Barbour et al. (1999) • Taxa added as we encounter checklists or taxonomic revisions • Total of 10,491 (85%) are insect taxa • Features: • Standard Taxonomic Effort • Taxonomic Serial Numbers • Tolerance Values • Species Traits • Geographic Distribution • Supported by >670 pieces of literature (books, articles, etc.)
Standard Taxonomic Effort • Indicates standard taxonomic level to stop at when identifying invertebrates • Usually genus level • Some species level • Sometimes family or subfamily level • Indicates appropriate literature to use • Identifies monospecific genera at Nearctic, regional, or state levels • Identifies synonyms, so proper name can be used • Includes some distributional information
Taxonomic Serial Numbers • TSNs are unique numbers assigned to each taxon • U.S. Department of Agriculture • Integrated Taxonomic Information System • Standardized identification system
Tolerance Values • Based on Saprobien System of early 1900s • Chutter (1972) first to assign tolerance values • Hilsenhoff Biotic Index (HBI - 1977) • Wisconsin • Designed to identify organic pollution • Values based mostly on professional experience • Some at Family level, but generally use genus and species level TVs
TV Tolerance Values 4 – 6 Moderate 7 – 10 Tolerant 0 – 3 Intolerant 0 - Pristine 10 - Degraded
Hilsenhoff Biotic Index HBI = Σ (density * TV) / Total Density