Download
1 / 21
220 likes | 466 Vues
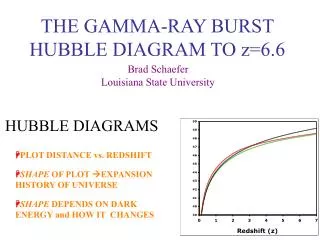
PLOT DISTANCE vs. REDSHIFT SHAPE OF PLOT EXPANSION HISTORY OF UNIVERSE SHAPE DEPENDS ON DARK ENERGY and HOW IT CHANGES. THE GAMMA-RAY BURST HUBBLE DIAGRAM TO z=6.6. Brad Schaefer Louisiana State University. HUBBLE DIAGRAMS. 1997: Perlmutter et al. 1997, ApJ, 483, 565

E N D
PLOT DISTANCE vs. REDSHIFT SHAPE OF PLOT EXPANSION HISTORY OF UNIVERSE SHAPE DEPENDS ON DARK ENERGY and HOW IT CHANGES THE GAMMA-RAY BURST HUBBLE DIAGRAM TO z=6.6 Brad Schaefer Louisiana State University HUBBLE DIAGRAMS
1997: Perlmutter et al. 1997, ApJ, 483, 565 — 7 SNe at z>0.35 — Consistent with Flat & W=1 1998/9: Perlmutter et al. 1999, ApJ, 517, 565 Riess et al. 1998, AJ, 116, 1009 — 42 & 16 SN 0.16<z<0.83 — Universe will expand forever — Expansion is accelerating — “Dark Energy” is ‘pushing’ 2004: Riess et al. 2004, ApJ, 607, 665 — 10 SNe at 1<z<1.76 with HST — DecelerationAcceleration at z~0.46 2005: Astier et al. 2005, ApJ, 607, 665 — 71 SNe at z<1 — w=-1.023±0.090 — No constraint on change of w 2012?: http://snap.lbl.gov/ — ~2000 SNe at z<1.7 SN HUBBLE DIAGRAMS WHAT IT TOOK TO CONVINCE THE COMMUNITY: Duplication by other groups Deep search for problems and complexities Confirmation by other methods
1997: Perlmutter et al. 1997, ApJ, 483, 565 — 7 SNe at z>0.35 — Consistent with Flat & W=1 1998/9: Perlmutter et al. 1999, ApJ, 517, 565 Riess et al. 1998, AJ, 116, 1009 — 42 & 16 SN 0.16<z<0.83 — Universe will expand forever — Expansion is accelerating — “Dark Energy” is ‘pushing’ 2004: Riess et al. 2004, ApJ, 607, 665 — 10 SNe at 1<z<1.76 with HST — DecelerationAcceleration at z~0.46 2005: Astier et al. 2005, ApJ, 607, 665 — 71 SNe at z<1 — w=-1.023±0.090 — No constraint on change of w 2012?: http://snap.lbl.gov/ — ~2000 SNe at z<1.7 What is the expansion history for z>1.7? SN HUBBLE DIAGRAMS WHAT IT TOOK TO CONVINCE THE COMMUNITY: Duplication by other groups Deep search for problems and complexities Confirmation by other methods
CALIBRATION OF SIX LUMINOSITY INDICATORS SPECTRAL LAG VARIABILITY PEAK PHOTON ENERGY TIME OF JET BREAK MINIMUM RISE TIME NUMBER OF PEAKS THEORETICAL LIMIT
PRIOR WORK: Author (Reference) # GRBs # Lum Ind. Schaefer (2001, three public talks) 8 GRBs 2 (tlag,V) Schaefer (2003, ApJLett, 583, 67) 9 GRBs 2 (tlag,V) Bloom et al. (2003, ApJ, 594, 674) 16 GRBs 1 (tbreak) Xu, Dai, Liang (2005, ApJ, 633, 603) 17 GRBs 1 (tbreak) Firmani et al. (2005, MNRAS, 360, 1) 15 GRBs 1 (tbreak) Liang & Zhang (2005, ApJ, 633, 611) 15 GRBs 1 (tbreak) Schaefer (This work)60 GRBs 5 (tlag,V,Ep, tbreak, trise) THIS WORK: 60 GRBs 27 with z>2, 14 with z>3, 6 with z>4, and 2 with z>6 26 with SWIFT, 16 with HETE, 8 with BATSE, 6 with KONUS, 3 with SAX, 1 with INTEGRAL Combine information from all 5 luminosity indicators to get best luminosity Must simultaneously fit cosmology and luminosity relations GRB HUBBLE DIAGRAM (Schaefer 2003)
ACCURACY FOR INDIVIDUAL SNe & GRBs: µ (overall) OBJECT Median Best SNe*0.23 mag 0.15 mag GRB 0.60 mag 0.21 mag *Gold & Silver sample from Riess et al. (2004 ApJ, 607, 665) SN ADVANTAGES: GRB ADVANTAGES: 2.6X more accurate singly Uniquely covers 1.7< z < 6.6 Physics of SNe is well known No problem from extinction (or Ly-a clouds) Results are ‘free’ and now SN & GRB COMPARISON One SN is on average 2.6x more accurate than one GRB
60 GRB HUBBLE DIAGRAM ‘Standard’ cosmology: Flat Universe with WM=0.27±0.04, Cosmological Constant [w=-1 and unchanging for w=P/rc2]
8 NEW GRBs SINCE JANUARY ‘Standard’ cosmology: Flat Universe with WM=0.27±0.04, Cosmological Constant [w=-1 and unchanging for w=P/rc2]
DERIVED DISTANCES DEPEND LITTLE ON ASSUMED COSMOLOGY ‘Standard’ cosmology [WM=0.27, Flat Universe, w0 = -1, w= 0] versus Best Fit cosmology [WM=0.27, Flat Universe, w0 = -1.4, w = 1.3]
60 GRB HUBBLE DIAGRAM ‘Standard’ cosmology: Flat Universe with WM=0.27±0.04, Cosmological Constant [w=-1 and unchanging for w=P/rc2]
APPEARS TO BE FLAT AT z>2.5 ‘Standard’ cosmology: Flat Universe with WM=0.27±0.04, Cosmological Constant [w=-1 and unchanging for w=P/rc2]
APPEARS TO BE FLAT AT z>2.5 ‘Standard’ cosmology: Flat Universe with WM=0.27±0.04, Cosmological Constant [w=-1 and unchanging for w=P/rc2]
SEARCH FOR BEST COSMOLOGY Assume Flat Universe, marginalize over WM Assume Equation of state; w=P/rc2, let w vary as w0+wz or w0+wa*z/(1+z) Cosmological Constant has w=-1 and w=wa=0 w = w0 + w zw = w0+wa*z/(1+z) Cosmological Constant at 2.8s level Cosmological Constant at 2.3s level
WHAT IS BEST WM? Assume Flat Universe with w0 = -1.4 and w = 1.3 One Sigma: 0.25< WM <0.59
SEARCH FOR BEST COSMOLOGY Assume Flat Universe with WM=0.27±0.04, w = w0 + w zw = w0+wa*z/(1+z) Cosmological Constant rejected at 3.5s level Cosmological Constant rejected at 3.7s level
BEST FIT COSMOLOGY Best Fit cosmology: Flat Universe with WM=0.27±0.04, w0 = -1.4, w=dw/dz = 1.3, w=P/rc2=w0+wz
GRB HUBBLE DIAGRAM FLATTENS FOR z>2.5: Best fit has w0 = -1.4 and w = 1.3 Cosmological Constant rejected at 3.5s level In good agreement with Gold & Silver SNe If Dark Energy changes with time, then it is not vacuum energy FIRST RESULTS FROM NEW METHOD
MALMQUIST BIAS: Very difficult problem to calculate, because conditions for detecting burst as a function of redshift are highly inhomogenous and not well known GRAVITATIONAL LENSING AMPLIFICATION AND DEAMPLIFICATION BY FOREGROUND GALAXIES: Any resulting bias is likely to be insignificant (Daniel Holz 2005) WHAT ARE THE IMPLICATIONS FOR STAR FORMATION IMPLIED BY A FLATTENED HUBBLE DIAGRAM? Is such a flattening consistent with what we know? WHAT ARE EFFECTS OF EVOLUTION? I claim the effects will be near-zero because the GRB luminosity indicators are based on quantities like conservation of energy in jet and light travel time, and these do not evolve with time or metalicity; while it does not matter if the typical luminosities change with time so long as the calibration of the relations is based on the physics of the situation. QUESTIONS & POTENTIAL PROBLEMS
FIRST RESULT MUST BE CHECKED WITH INDEPENDENT SAMPLE OF GRBs: HETE & SWIFT will get ~60 more GRBs with redshifts in ~2 years FIRST RESULTS MUST SURVIVE SCRUTINY, IMPROVEMENTS, AND PROBLEMS: Many people need to examine this from many directions FIRST RESULT MUST BE CONFIRMED/DENIED BY INDEPENDENT METHODS: Perhaps with lensing or quasars… FUTURE
NEW METHOD TO MEASURE DARK ENERGY: Unique information for 1.7< z < 6.6 FIRST RESULTS: 60 GRBs from 0.2< z < 6.6 HUBBLE DIAGRAM FLATTENS FOR z>2.5: Dark Energy changes over time, (Cosmological Constant rejected at 3.5s) or Hi-z GRBs are brighter by ~3X (Malmquist bias?) THIS RESULT MUST BE CONFIRMED OR DENIED BY INDEPENDENT STUDY: Independent GRB data (60 more HETE & SWIFT bursts) Independent methods (perhaps lensing or quasars...) CONCLUSIONS