Download
1 / 14
140 likes | 279 Vues
Figure 11.1. Schematic depicting tunneling across a normal-insulator-normal (NIN) junction at T=0. (Reproduced with kind permission of J. Hergenrother.). Figure 11.2. The electron tunneling rate through a NIN junction as a function of change in system free energy at different values of k B T.

E N D
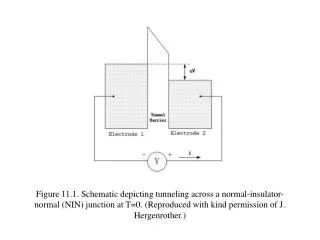
Figure 11.1. Schematic depicting tunneling across a normal-insulator-normal (NIN) junction at T=0. (Reproduced with kind permission of J. Hergenrother.)
Figure 11.2. The electron tunneling rate through a NIN junction as a function of change in system free energy at different values of kBT.
Figure 11.3. A schematic diagram of the single electron transistor showing two small capacitance tunnel junctions characterized by junction resistance R and capacitance C, and also the capacitively coupled gate.
Figure 11.4. The Helmholtz free energy of the system as a function of Qo/e for various charge states n at V=0.
Figure 11.5. (a) Energy diagram of a SET with symmetric junction capacitances. Coulomb blockade exists when the tunneling process is energetically unfavorable.
Figure 11.5. (b) When bias voltage sources provide enough energy to overcome the charging energy barrier, single electron tunneling occurs.
Figure 11.5. (c) At Qo=e/2, the potential of the island is lowered by EC so that Coulomb blockade is absent at all bias voltages.
Figure 11.6. I-V curves at T=0 for a NNN SET with identical junction resistances and capacitance for the cases of Qo=0 and Qo=e/2.
Figure 11.7. V-Vg diagram showing the Coulomb blockade for a symmetric SET in the n=0 state.
Figure 11.8. Schematic of an inelastic co-tunneling process. Although it is in the Coulomb blockade region, electron can still be transported across the device by simultaneous tunneling across both junctions, and leaving an electron and a hole excitation on the island.
Figure 11.9. I (V, Vg) data for a SSS sample. Upper graph shows the Josephson-Quasiparticle peaks, and the lower graph shows the supercurrent which depends strongly on the value of Qo.
Figure 11.10. Experimental I-Qo curves for a NSN sample at a small bias voltage (V=125mV) with temperatures ranging from 50 to 300 mK. The curves are displaced upward successively for clarity. At low temperatures, the curves are strongly 2e-periodic. As temperature is gradually increased, the curves evolve until they become completely e-periodic above a crossover temperature T* ~ 285 mK for this sample.
Figure 11.11. A high magnification SEM micrograph showing a SSS SET sample with 2 mm long island and 70 nm wide leads. It also shows the fabricated gate which allows the control of the number of electrons on the island. (Reproduced with kind permission of J. Hergenrother.)
Figure 11.12. A SSS SET acts as a photon-activated switch. Near Qo=0, the secondary current peak corresponds to the tunneling of many electrons for every absorbed photon.