Sample Size Calculation for Confidence Interval Estimation of Proportion p
70 likes | 206 Vues
This guide provides a detailed approach to determining the sample size necessary for estimating the population proportion p within a specified confidence interval (±E). It discusses two scenarios: (1) when a prior estimate of p is available, and (2) when no estimate exists, adopting p = 0.5 as the "worst-case" scenario. Using examples, including estimating the percentage of Coke drinkers with a desired accuracy of ±0.04 at 95% confidence, we explain how to apply the formula for sample size (n) based on known and unknown parameters.

Sample Size Calculation for Confidence Interval Estimation of Proportion p
E N D
Presentation Transcript
The Confidence Interval (Point Estimate) z/2(Appropriate St’d Deviation) The confidence interval is:
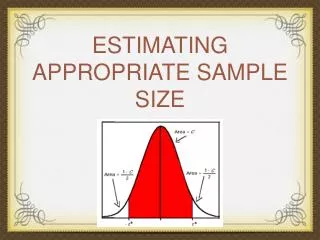
What Should Be Used For p? • If there is some idea -- use this value • If there is no idea -- take “worst case” scenario • Worst case is where the standard deviation is as large as it can get • This happens when p = .5
Example • How large a sample must be drawn to estimate the true percentage of Coke drinkers to within .04 (with 95% confidence) if: • (1) Last week a similar survey found that 60% favored Coke • (2) There is no estimate for the percentage of Coke drinkers • The 95% confidence interval is
Case 1A Recent Estimate For p Was p = .6 • Use p = .6 in the 95% confidence interval. • The “” part must = .04. Thus,
Case 2There Is No Estimate For p • Use p = .5 in the 95% confidence interval • The “” part must = .04. Thus,
Review • To determine a value for n so that p is estimated to within ±E with confidence 1-α, solve for n in the formula: • If there is an estimate for p, use it. • If there are no estimates for use p = .5.