Fuzzy Verification toolbox: definitions and results
300 likes | 374 Vues
Fuzzy Verification toolbox: definitions and results. Felix Ament MeteoSwiss, Switzerland. Mesoscale model (5 km) 21 Mar 2004. Global model (100 km) 21 Mar 2004. Observed 24h rain. Sydney. Sydney. RMS=13.0. RMS=4.6. Motivation for new scores. Which rain forecast would you rather use?.

Fuzzy Verification toolbox: definitions and results
E N D
Presentation Transcript
Fuzzy Verification toolbox: definitions and results Felix AmentMeteoSwiss, Switzerland
Mesoscale model (5 km) 21 Mar 2004 Global model (100 km) 21 Mar 2004 Observed 24h rain Sydney Sydney RMS=13.0 RMS=4.6 Motivation for new scores Which rain forecast would you rather use?
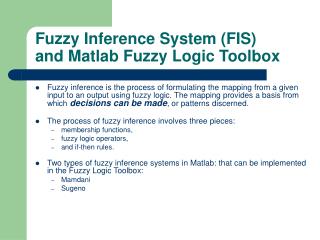
Fine scale verification: Fuzzy Methods “… do not evaluate a point by point match!” General Recipe • (Choose a threshold to define event and non-event) • define scales of interest • consider statistics at these scales for verification Scale Evaluate box statistics forecast observation score depends on spatial scale and intensity x x Intensity
A Fuzzy Verification Toolbox Ebert, E.E., 2007: Fuzzy verification of high resolution gridded forecasts: A review and proposed framework. Meteorol. Appls., submitted.Toolbox available at http://www.bom.gov.au/bmrc/wefor/staff/eee/fuzzy_verification.zip
Applying fuzzy scores Fuzzy scores provide a wealth of information, but • the results seems to be contrasting • their interpretation is sometimes difficult • contain too many numbers poor good
Application versus testbed Application Testbed
A Fuzzy Verification testbed Virtual truth (Radar data, model data, synthetic field) Fuzzy Verification Toolbox Perturbation Generator Realizations of virtual erroneousmodel forecasts Analyzer Realizations ofverification results • Assessment of • sensitivity (mean) • [reliability (STD)] • Two ingredients: • Reference fields: Hourly radar derived rain fields, August 2005 flood event, 19 time stamps (Frei et al., 2005) • Perturbations: next slide
Perfect forecast All scores should equal ! • But, in fact, 5 out of 12 do not!
Effect of „Leaking“ Scores Problem: Some methods assume no skill at scales below window size! An example: Joint probability method forecast observation pobs=0.5 pforecast=0.5 Forecast Assuming random ordering within window Not perfect! OBS
Expected response to perturbations coarse spatial scale fine low highintensity Sensitivity: expected (=0.0); not expected (=1.0) Summary in terms of contrast: Contrast := mean( ) – mean( )
Summary real good Contrast Leaking Scores • Leaking scores show an overall poor performance • “Intensity scale” and “Practically Perfect Hindcast” perform in general well, but … • Many score have problem to detect large scale noise (LS_NOISE); “Upscaling” and “50% coverage” are beneficial in this respect STD good
Spatial detection versus filtering Dx=25km Horizontal translation (XSHIFT) with variable displacement Dx • “Intensity scale” method can detect spatial scale of perturbation • All other methods like the “Fraction Skill score” just filter small scale errors Dx=10km Dx=5km
Redundancy of scores • Correlation (%) of resulting scores between all score for all thresholds, window sizes – averaged over all types of perturbation: • Groups of scores: • UP, YN, MC, FB, PP • FZ, JP • FB, PP, (IS)
August 2005 flood event Precipitation sum 18.8.-23.8.2005: (Hourly radar data calibrated using rain gauges (Frei et al., 2005)) Mean: 106.2mm Mean: 73.1mm Mean: 62.8mm Mean: 43.2mm
Fuzzy Verification of August 2005 flood Based on 3 hourly accumulations during August 2005 flood period (18.8.-23.8.2005) COSMO-2 COSMO-7 Scale(7km gridpoints) Intensitythreshold (mm/3h) good bad
Fuzzy Verification of August 2005 flood Difference of Fuzzy Scores COSMO-2 better neutral Scale(7km gridpoints) COSMO-7 better Intensity threshold (mm/3h)
RADAR D-PHASE Demonstration of Probabilistic Hydrological and Atmospheric Simulation of flood Events in the Alpine region • Operational phase (June until November 2007) is running • 33 atmospheric models take part … • … and store there output in a common format in one data archive Standard verification (see Poster) Let’s apply the fuzzy toolbox • Models: COSMO -2, -7, -DE, -EU • Period: August 2007 • Lead times: most recent forecast starting at forecast hour +03. • Observations: Swiss Radar data aggregated on each model grid • To be verified: 3h accumulation of precip.
D-PHASE: August 2007Intensity Scale score (preliminary), 3h accumulation COSMO-2 COSMO-7 COSMO-DE COSMO-EU
Conclusions • Fuzzy Verification score are a promising framework for verification of high resolution precipitation forecasts. • The testbed is a useful tool to evaluate the wealth of scores (not necessarily fuzzy ones): • Not all scores indicate a perfect forecast by perfect scores (Leaking scores). • The “intensity scale” method is able to detect the specific scale of an spatial error. • MeteoSwiss goes for: Upscaling, Intensity scale, Fraction skill score ( and Pracitically perfect hindcast) methods. • First long term application for D-PHASE has just started.
Summary ideal good Contrast Leaking Scores STD good
Mean: 73.1mm Mean: 43.2mm Mean: 62.8mm Mean: 106.2mm August 2005 flood event Precipitation sum 18.8.-23.8.2005: 7
August 2005 flood event Fuzzy Verification (hourly accumulations): COSMO-2 COSMO-7
August 2005 flood event Fuzzy Verification COSMO-2 – COSMO-7: • Suprisingly, small differences • However, COSMO2 seems to be slightly better slightly better at