Download
1 / 36
360 likes | 474 Vues
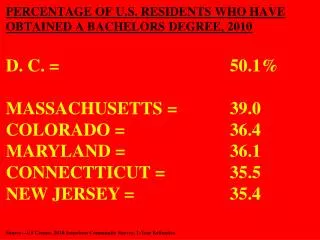
PERCENTAGE OF U.S. RESIDENTS WHO HAVE OBTAINED A BACHELORS DEGREE, 2010. D. C. = 50.1% MASSACHUSETTS = 39.0 COLORADO = 36.4 MARYLAND = 36.1 CONNECTTICUT = 35.5 NEW JERSEY = 35.4 Source—US Census, 2010 American Community Survey, 1-Year Estimates.

E N D
PERCENTAGE OF U.S. RESIDENTS WHO HAVE OBTAINED A BACHELORS DEGREE, 2010 D. C. = 50.1% MASSACHUSETTS = 39.0 COLORADO = 36.4 MARYLAND = 36.1 CONNECTTICUT = 35.5 NEW JERSEY = 35.4 Source—US Census, 2010 American Community Survey, 1-Year Estimates
PERCENTAGE OF U.S. RESIDENTS WHO HAVE OBTAINED A BACHELORS DEGREE, 2010 VIRGINIA = 34.2 VERMONT = 33.6 NEW HAMPSHIRE = 32.8 NEW YORK = 32.5 MINNESOTA = 31.8 WASHINGTON = 31.1 ILLINOIS = 30.8 RHODE ISLAND = 30.2 CALIFORNIA = 30.1
PERCENTAGE OF U.S. RESIDENTS WHO HAVE OBTAINED A BACHELORS DEGREE, 2010 KANSAS = 29.8 HAWAII = 29.5 UTAH = 29.3 MONTANA = 28.8 OREGON = 28.8 NEBRASKA = 28.6 ALASKA = 27.9 STATE AVERAGE = 27.9
PERCENTAGE OF U.S. RESIDENTS WHO HAVE OBTAINED A BACHELORS DEGREE, 2010 DELAWARE = 27.8 NORTH DAKOTA = 27.6 GEORGIA = 27.3 PENNSYLVANIA = 27.1 MAINE = 26.8 NORTH CAROLINA = 26.5 SOUTH DAKOTA = 26.3 WISCONSIN = 26.3 ARIZONA = 25.9 TEXAS = 25.9 FLORIDA = 25.8 MISSOURI = 25.6 MICHIGAN = 25.2 NEW MEXICO = 25.0
PERCENTAGE OF U.S. RESIDENTS WHO HAVE OBTAINED A BACHELORS DEGREE, 2010 IOWA = 24.9 OHIO = 24.6 SOUTH CAROLINA = 24.5 IDAHO = 24.4 WYOMING = 24.1 TENNESSEEE = 23.1 OKLAHOMA = 22.9 INDIANA = 22.7 NEVADA = 21.7 LOUISIANA = 21.4 ALABAMA = 21.9 KENTUCKY = 20.5 ARKANSAS = 19.5 MISSISSIPPI = 19.5 WEST VIRGINIA = 17.5
“It is easier to build strong children than to repair broken men.” Frederick Douglas, New York Times, 3/1/’14
Latinos, 25-Years & Up, 2011Less than 9th Grade = 5.51 million, 20.7%9th to 12th Grade = 4.00, 15.0%High School graduate = 7.96, 29.8%Some College/Assoc. Degree = 5.44, 20.4%Bachelor’s Degree = 2.67, 10.0%Advanced Degree = 1.09, 4.1%Source: US Census Bureau, Current Population Survey, Annual Social & Economic supplement, 2011
US Latinos, Nursery School* 2011 --White = 1.33 Million --Hispanic = 0.77 [26.6%] --Black = 0.56 --Asian = 0.12 --TOTAL = 2.90 *--Enrollmemt on Public Nursery Schools by 3-yrs. old and up Source: Hispanic Student Enrollments reach new Highs in 2011, PEW Hispanic Center, August 20, 2012
US Latinos, Kindergarden* 2011 --White = 1.90 Million --Hispanic = 0.98 [26.3%] --Black = 0.50 --Asian = 0.19 --TOTAL = 3.73 *--Enrollmemt on Public Kindergarden Schools by 3-yrs. old and up Source: Hispanic Student Enrollments reach new Highs in 2011, PEW Hispanic Center, August 20, 2012
US Latinos, Elementary School* 2011 --White = 15.67 Million --Hispanic = 7.40 [24.7%] --Black = 4.66 --Asian = 1.34 --TOTAL = 29.97 *--Enrollmemt on Public Elementary Schools by 3-yrs. old and up Source: Hispanic Student Enrollments reach new Highs in 2011, PEW Hispanic Center, August 20, 2012
“Hispanic students accounted for more than half of all eight graders in California in 2011, the highest proportion in the country. But only 14% of those students were proficient on eight-grade reading tests....” Source: New York Times, February 22, 2013
US Latinos, High School* 2011 --White = 8.54 Million --Hispanic = 3.29 [26.5%] --Black = 2.55 --Asian = 0.64 --TOTAL = 12.43 *--Enrollmemt on Public High Schools by 3-yrs. old and up Source: Hispanic Student Enrollments reach new Highs in 2011, PEW Hispanic Center, August 20, 2012
US Latinos High School Completion Rate for 18 to 24 yrs. olds Latinos: --2000 = 59% --2011 = 76% Source: Hispanic Student Enrollments reach new Highs in 2011, PEW Hispanic Center, August 20, 2012
US Latinos, College* 2011 --White = 7.88 Million --Hispanic = 2.08 [16.5%] --Black = 1.64 --Asian = 0.75 --TOTAL = 12.57 *--Enrollmemt in Colleges by 18 to 24-year-olds. Source: Hispanic Student Enrollments reach new Highs in 2011, PEW Hispanic Center, August 20, 2012
US Latinos, In College* 2011 --Asians = 79.4% --Whites = 75.9% --Blacks = 65.6% --Latinos = 56.3% *--Of All Attending College, Percent Enrolled in four-year Colleges, ages 18 to 24 Source: Hispanic Student Enrollments reach new Highs in 2011, PEW Hispanic Center, August 20, 2012
US Latinos, In College* 2011 --Asians = 20.6% --Whites = 24.1% --Blacks = 34.4% --Latinos = 43.7% *--Of All Attending College, Percent Enrolled in two-year Colleges, ages 18 to 24 Source: Hispanic Student Enrollments reach new Highs in 2011, PEW Hispanic Center, August 20, 2012
College Choice, 2011 --75% of students at the 200 most highly rated colleges came from families in the top quartile of income. --5% came from families in the bottom quartile of income--in 1994, it was 3% Source: New York Times, Op-Ed, May 18, 2014
College Choice, 2011 --”About a quarter [25%] of college freshmen born into the bottom half of the income distribution will manage to collect a bachelor’s degree by age 24, while almost 90% of freshmen born into families in the top income quartile will go on to finish their degrees.” Source: New York Times, Op-Ed, May 18, 2014
They [issues] include the question of our place in this society; of how we are imagined within it; and of the role we students of the historical experience and current circumstances of our various communities might play in the evolution of American society. Madrid, Arturo,“Their America, Our América and Our Responsibility as Latina/o Scholars”, Nov., 18, ‘12
Our 25-45 age population has less educational attainment than their 45-65 old counterparts. Only the education of the 15-25 old population can turn that around, and we have reasons to be concerned about that matter.Madrid, Arturo,“Their America, Our América and Our Responsibility as Latina/o Scholars”, Nov., 18, ‘12
Median Household Income, ‘10 Source: New York Times, September, 15,2011 --Asians = $64,308 --Whites = $54,620 --Blacks = $32,068 --Latinos = $37,379
Per-Pupil Costs/Yr. --$15,969 for MPS, ‘11 --$9,718 for Milwaukee independent charter schools, ‘11 --$4,442 for Milwaukee voucher students, ‘11 Source: Milwaukee Journal/Sentinel, January 18, ‘13
Segregation in Public Schools --43% of Latinos in schools with < 10% whites, ‘09-’10 --38% of Blacks in schools with < 10% whites, ‘09-’10 --Approx. 15% of Latinos & Blacks in schools with < 1% white,’09-’10 --”Latino segregation more pronounced in CA, NY, & TX” Source: New York Times, September 20, ‘12
US Latinos--Education --What role should YOU play in increasing Latino HS enrollment & completion? --Do YOU see it as a role you should play?
US Latinos—Education… --For the 9.51 million adult Latinos in our country that have less than a high school education, what’s their future like? --What’s the country’s current adult education capabilities?
US Latinos—Education… --Latinos represent 23% of all 5-to-17-yrs.-olds in our country, what’s their future like? --What’s the country’s future like if current Latino college enrollment continues into the future?
US Latinos—Education… --About 10.0% of Latinos 25-yrs. and older have a bachelor’s degree, whereas 32.1% of non-Hispanic Whites do—how difficult is it and how long will it take to get the Latino rate on par with non-Hispanic Whites?
What must we do?--First and foremost, we must continue to affirm our place in this nation.--Second, we must continue to carve out larger and more significant spaces for ourselves in this society and its institutions.--Third, we must revitalize the ideals of this nation.Madrid, Arturo,“Their America, Our América and Our Responsibility as Latina/o Scholars”, Nov., 18, ‘12
“In the wild world, you’re either eating something or being eaten…in the human world, you either define yourself or you’re defined.” Unknown