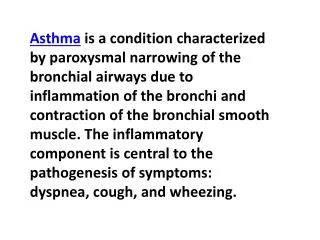
Download
1 / 12
120 likes | 309 Vues
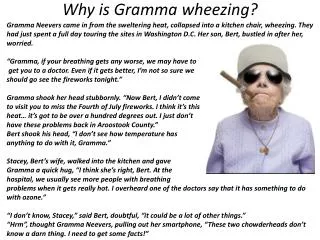
Why is Gramma wheezing?. Gramma Neevers came in from the sweltering heat, collapsed into a kitchen chair, wheezing. They had just spent a full day touring the sites in Washington D.C. Her son, Bert, bustled in after her, worried. “ Gramma , if your breathing gets any worse, we may have to

E N D
Why is Gramma wheezing? GrammaNeevers came in from the sweltering heat, collapsed into a kitchen chair, wheezing. They had just spent a full day touring the sites in Washington D.C. Her son, Bert, bustled in after her, worried. “Gramma, if your breathing gets any worse, we may have to get you to a doctor. Even if it gets better, I’m not so sure we should go see the fireworks tonight.” Gramma shook her head stubbornly. “Now Bert, I didn’t come to visit you to miss the Fourth of July fireworks. I think it’s this heat… it’s got to be over a hundred degrees out. I just don’t have these problems back in Aroostook County.” Bert shook his head, “I don’t see how temperature has anything to do with it, Gramma.” Stacey, Bert’s wife, walked into the kitchen and gave Grammaa quick hug, “I think she’s right, Bert. At the hospital, we usually see more people with breathing problems when it gets really hot. I overheard one of the doctors say that it has something to do with ozone.” “I don’t know, Stacey,” said Bert, doubtful, “it could be a lot of other things.” “Hrm”, thought GrammaNeevers, pulling out her smartphone, “These two chowderheads don’t know a darn thing. I need to get some facts!”
Using large pollution data sets in introductory agriculture, biology, and environmental classes Group Members: Justin Pruneski, Rich Rosecrance, Rob Swanson, Bruce Wiggins Summary: Our goal is to create a case study module to investigate EPA air pollution data, while identifying key components of the process that can be applied to other data sets for further case investigations Target audience: First-year college students (with suggestions for adding material for more advanced courses). Some Excel skills assumed.
Objectives • Instructor will be able to: • Identify potential sources of data for students to explore • Facilitate student exploration of prior knowledge and interests • Guide students use of helpful resources and data sources • Students will be able to: • Summarize the central issues of the case • Develop a question that can be answered with big data • Identify and access large data sets • Use Microsoft Excel to manipulate data and perform statistical analysis • Use Microsoft Excel to make graphs and charts to visualize data • Use data generated to support or refute their hypotheses • Communicate their results and persuade their peers
General Structure of the lesson From: "How to Use Investigative Cases with Examples" Phase I 1. Introduce the Case - Students read the case and get (hopefully) get invested in the topic 2. Recognize Potential Issues - Students reread to clear up confusion and extract more info 3. Identify Major Themes - Students brainstorm what the case is about 4. Pose Specific Questions - Students brainstorm what they know about the topic and what they want to know Example: analysis of ozone data from EPA Phase II 5. Obtain Additional Resources - Students explore what type of resource they need to address their questions and try to find them 6. Define Problems - Students refine their questions 7. Design and Conduct Scientific Investigations - Students use available resources to collect and analyze data to address their questions Phase III 8. Produce Materials to Support Conclusions - Students communicate the research of their investigation to the class and try to persuade them that their conclusions are valid
EPA Site www.teo.unc
Ozone levels (ppm) at 2 sampling sites--2011 Aroostook County, Maine Washington DC Federal standard (0.075 ppm)
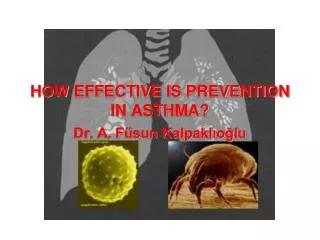
Potential student questions with available resources • The link between forest fires or other exceptional events and ozone. See this website: www.epa.gov/airnow/2011conference/forecasting/Murphey.ppt. • The relationship between weather conditions and air pollution levels. See later on for a more detailed example. See http://weatherspark.com/ for one source of weather data • The effect of city size or population on air pollution levels • The effect of the number of vehicles on air pollution, or the amount of pollution produced from vehicles in different eras • Data for motor vehicle registrations per capita, from Gapminder USA http://www.gapminder.org/labs/ • Change in pollutant concentrations over time (This could be visualized using google motion chart, a gadget within Google Docs) • Comparing different pollutants (EPA site has data on CO, Pb, NO2, Ozone, PM10, PM2.5, and SO2) • The effects of air pollution on particular health conditions (ex. asthma, lung cancer). Asthma measures: http://www.cdc.gov/asthma/brfss/2010/brfssdata.htm • Are certain areas over/under the EPA standards (daily, monthly, yearly average). What is the right standard? • Comparison of US cities to other cities around the world (ex. Mexico City) • If students are interested in the effect of elevation, they can google elevation data for the particular cities/locations they are interested in • Type and amount of energy use. Data available from the U.S. Census Bureau, in Excel format http://www.census.gov/compendia/statab/cats/energy_utilities/electricity.html • Agricultural data. Data for total acreage of farm land, from Gapminder USA • http://www.gapminder.org/labs/ • Data for a number of different agricultural measures from the U.S. Census Bureau, in Excel Format http://www.census.gov/compendia/statab/cats/agriculture/crops.htmllture/crops.html
Interactive map of ozone sampling sites using Google Earth Google Earth Sampling Locations
Example Weather DataEffect of windEffect of temp R = 0.034 R2 = 0.0012
References The format and much of the instruction language for this case study was taken from Starting Point: Teaching Entry level Geoscience website, specifically the How to Use Investigative Cases with Examples webpage http://serc.carleton.edu/introgeo/icbl/how.html accessed 6/20/12 Anderson, W.; G.J. Prescott, S. Packham, J. Mullins, M. Brookes, and A. Seaton (2001). "Asthma admissions and thunderstorms: a study of pollen, fungal spores, rainfall, and ozone". QJM: an International Journal of Medicine (Oxford Journals) 94 (8): 429–433. DOI:10.1093/qjmed/94.8.429. PMID 11493720 Health Aspects of Air Pollution with Particulate Matter, Ozone and Nitrogen Dioxide Report on a WHO Working Group, Bonn, Germany 13–15 January 2003 Special thanks to: Karen Lucci, Margaret Waterman, Kelly Sturner Gary Morris for consultation on ozone and pollution issues