
Uploaded by
erma
0 SLIDES
172 VUES
0LIKES
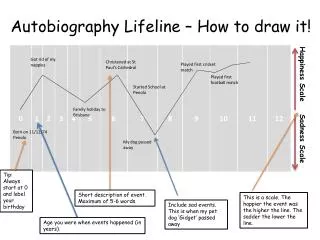
Scale
DESCRIPTION
Scale. Understanding its use, and how it affects us.
Download

1 / 0
Télécharger la présentation 
Scale
An Image/Link below is provided (as is) to download presentation
Download Policy: Content on the Website is provided to you AS IS for your information and personal use and may not be sold / licensed / shared on other websites without getting consent from its author.
Content is provided to you AS IS for your information and personal use only.
Download presentation by click this link.
While downloading, if for some reason you are not able to download a presentation, the publisher may have deleted the file from their server.
During download, if you can't get a presentation, the file might be deleted by the publisher.
E N D
Presentation Transcript
-
Scale
Understanding its use, and how it affects us. - Scale – perhaps the most important, and complicated, aspect of maps and geography. Scale typically refers to space in geography, but can also refer to thematic or temporal issues as well. Scale often determines the specificity or generality of the map. Scale
- Scale is the ratio between length measured on a map and the corresponding distance on the ground. Scale allows you to measure distance, area, and compare sizes. There are 3 types of scales: Verbal Numeric or Fractional Graphic Map Scales
- States in words the ratio of the map scale length to the distance on Earth’s surface i.e. “five centimeters to ten kilometers” Or “one inch to one mile” Verbal Scale
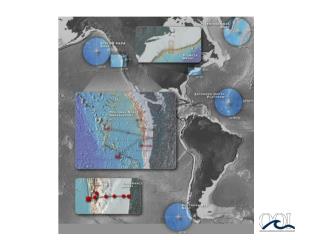
- A graduated line that measures distances on a map, chart, or photograph in terms of ground distance The advantage of a graphic scale is that you can measure distance directly on a map Graphic Scale
- Compares map distance with ground distance by proportional numbers Expressed as a fraction or ratio i.e. 1/10,000 or 1:10,000 Fractional Scale
- Scale size is counterintuitive – at first glance it will not make sense, and you will be confused. What number is larger, 2500 or 25000? What number is larger, 25000 or 250000? What number is larger, 250 or 2500? All of the numbers on the right are bigger. So, if you see two scales, 1:250 and 1:250000, which is bigger? Try this question – which map is bigger, a world map or a state map? If you answered world, you would be correct in the literal sense: the world is bigger than a state. However, which map shows more details like mountains, rivers, lakes, streams, valleys, plains, streets? Scale Size
- A large scale map has a small denominator 1:500 or 1/500 A small scale map has a large denominator 1:250,000 So, 1:500 is a larger SCALE than 1:250000 Large and Small Scale Maps
- Different maps need to show different levels of detail. Sometimes you need to show a lot detail for a small area, and sometimes you need to show little detail of a larger area. Comparing maps of different scale
- A map with a scale of 1:10,000,000 would be considered small scale when compared with a map of 1:1,000. This is a small scale map – there is no detail shown. There is such great area – the whole earth – it must be small scale. i.e. 1 inch must be equal to millions of inches on the earth
- Scale DifferencesMaps of Washington State
- Washington State (1:10 million scale)
- Western Washington(1:1 million scale)
- Seattle Region(1:100,000 scale)
- Downtown Seattle, Washington(1:10,000 scale)
- Big maps – maps that display a very large area but have little actual detail (world compared to country, country compared to state) – have small scales. Little maps – maps that display a smaller area on the earth’s surface (city compared to state, country compared to world) – have large scales. Still Confused?
- If all else fails, use simple math to figure it out: 1/24000 literally means 1 divided by 24000 = .000041 1/2400 literally means 1 divided by 2400 = .00041 .00041 is a larger number than .000041 Do The Math
- Scale can also be used to explain other phenomenon as well. Geographic scale can explain the movement of people from the countryside to cities. Geographic scales can explain the prevalence of disease in a community Geographic scale can explain election results. Geographic Scale
- The 2000 Presidential election took over one month to decide, and it all hinged on Florida. George W. Bush won Florida – or did he? A small-scale large-size state map makes us think all of Florida voted for Bush. But . . . The 2000 Election
- If we increase the scale from a statewide view to an electoral district view, we can see that Bush did not win every part of the state Taking a Closer Look at Florida
- If we increase the scale even more, to a county scale we can see even more democratic victories in Florida. By using geographic scale we can understand the controversy and the reason the race was so close. A Little Bit Closer Now
- Place in order from smallest to largest scale Indiana map; midwest map; Indiana/Illinois map; US map; NATO map; world map; Marion county map; Archindy map; Indianapolis map; Western Hemisphere map; NAFTA map Mental Exercise


More Related