Download
1 / 38
380 likes | 597 Vues
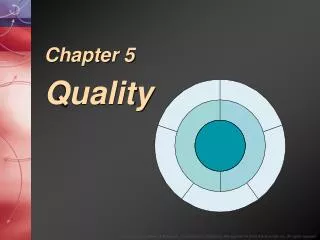
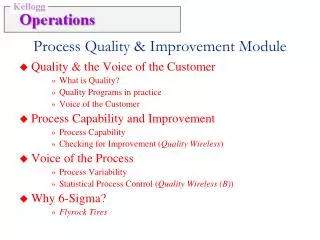
Process Quality & Improvement Module. Quality & the Voice of the Customer What is Quality? Quality Programs in practice Voice of the Customer Process Capability and Improvement Process Capability Checking for Improvement ( Quality Wireless ) Voice of the Process Process Variability

E N D
Process Quality & Improvement Module • Quality & the Voice of the Customer • What is Quality? • Quality Programs in practice • Voice of the Customer • Process Capability and Improvement • Process Capability • Checking for Improvement (Quality Wireless) • Voice of the Process • Process Variability • Statistical Process Control (Quality Wireless (B)) • Why 6-Sigma? • Flyrock Tires
8 Dimensions of Quality • Performance • Features • Serviceability • Aesthetics • Perceived Quality • Reliability • Conformance • Durability Lin/Operations/Quality
Elements of TQM • Management by fact • Cross-functional (process) approach • Culture and leadership • Customer focus • Employee focus • High performance focus • Continuous improvement • Benchmarking • External alliances - the value chain Source: Eitan Zemel Lin/Operations/Quality
Malcolm Baldridge National Quality Award • 1 Leadership 110 • 2 Strategic Planning 80 • Strategy Development Process • 3 Customer and Market Focus 80 • 4 Information and Analysis 80 • 5 Human Resource Development and Management 100 • 6 Process Management 100 • Product and Service Processes • Support Processes • Supplier and Partnering Processes • 7 Business Results 450 • TOTAL POINTS 1000 Lin/Operations/Quality
ISO 9000 • Series of standards agreed upon by the International Organization for Standardization (ISO) • Adopted in 1987 • More than 100 countries • A prerequisite for global competition? • ISO 9000: “document what you do and then do as you documented.” Design Procurement Production Final test Installation Servicing ISO 9003 ISO 9002 ISO 9001 Source: Adapted from Chase & Aquilano Lin/Operations/Quality
Components of Quality • Voice of the customer • Customer Needs • Quality of Design • Voice of the process • Quality of Conformance (Process Capability) • Process Variability Lin/Operations/Quality
Specification Example: US Open Tennis Balls • Wilson makes tennis balls for the US Open and sells a consumer version of the “same” ball. • Test balls by subjecting them to 18 pounds of force and measuring the extent of deformation. • Standard for Consumer Balls: 0.255′′ 0.035 • That is, 0.220′′ to 0.290′′ conform to the standard. • Standard for Tournament Balls: 0.2425′′ 0.0025 • That is, 0.240′′ to 0.245′′ conform to the standard. Lin/Operations/Quality
Reliability (40 %) % Repair Call Product (30%) Easy to Use (20%) % Calls for Help Features/Functions (40%) Function Performance Test Knowledge (30%) Supervisor Observations Sales (30%) Response (25%) % Proposals Mad on Time Follow-Up (10%) % Follow-Up Made Delivery Interval (30%) Average Order Interval Overall Quality Installation (10%) Does Not Break (25%) % Repair Reports Installed When Promised % Installed on Due Date No Repeat Trouble (30%) % Repeat Reports Repair (15%) Fixed Fast (25%) Average Speed of Repair Kept Informed (10%) % Customers Informed Accuracy, No Surprise (45%) % Billing Inquiries Billing (15%) Response on First Call (35%) % Respolved First Call Easy to Understand (10%) % Billing Inquiries Voice of the Customer: Linking Customer Needs to Business Processes Business ProcessCustomer NeedInternal Metric Source: Kordupleski et al., CMR ‘93. Lin/Operations/Quality
Voice of the Customer: Quality Function Deployment • What do customers want? • Are all preferences equally important? • Will delivering perceived needs deliver a competitive advantage? • How can we change the product? • How do engineering characteristics influence customer perceived quality? • How does one engineering attribute affect another? • What are the appropriate targets for the engineering characteristics? Lin/Operations/Quality
Correlation: 10 6 6 9 2 3 House of Quality Strong positive X Positive X X Negative X X X Strong negative * Engineering Characteristics Competitive evaluation Door seal resistance Check force on level ground X = Ours Energy needed to close door Energy needed to open door Accoust. Trans. Window Water resistance A = Comp. A Importance to Cust. B = Comp. B Customer Requirements (5 is best) + + 1 2 3 4 5 - + - - AB X X Easy to close 7 X AB Stays open on a hill 5 Easy to open 3 XAB A X B Doesn’t leak in rain 3 No road noise 2 X A B Relationships: Importance weighting Strong = 9 Medium = 3 Target values Reduce energy level to 7.5 ft/lb Small = 1 Reduce energy to 7.5 ft/lb. Reduce force to 9 lb. Maintain current level Maintain current level Maintain current level 5 BA BA B B BXA X Technical evaluation (5 is best) B 4 X A X A 3 A X 2 X Source: Hauser and Clausing 1988 1
Quality & the Voice of the Customer: Key Learning Objectives • Elements of TQM / Baldridge / ISO 9000 • Components of Quality • Voice of the Customer • Linking business processes to customer needs • Convert customer needs to product and process specifications: QFD Lin/Operations/Quality
Process Quality & Improvement Module • Quality & the Voice of the Customer • What is Quality? • Quality Programs in practice • Voice of the Customer • Process Capability and Improvement • Process Capability • Checking for Improvement (Quality Wireless) • Voice of the Process • Process Variability • Statistical Process Control (Quality Wireless (B)) • Why 6-Sigma? • Flyrock Tires Lin/Operations/Quality
Process Capability • Percent defective • Proportion of output that does not meet customer specifications • Sigma-capability • Number of standard deviations from the mean of the process output to the closest specification limit. Lin/Operations/Quality
Quality Wireless (A): Capability Within Specs Out of Specs Lin/Operations/Quality
Quality Wireless (A): Capability • Proportion of days within specification in 2003-04 = 491/731 = 0.672 • The call center had a mean hold time of 99.67 with a standard deviation of 24.24. With a specification of 110 seconds or less, σ-capability of call center = (110 – 99.67)/24.24 = 0.426 The call center is a 0.426-sigma process. Expected fraction of days within specifications from a 0.426-sigma process = NORMSDIST(0.426) = 0.665 Lin/Operations/Quality
Process Improvement? Lin/Operations/Quality
Continuous Improvement:PDCA Cycle (Deming Wheel) Institutionalize the change or abandon or do it again. Plan a change aimed at improvement. 1. Plan 4. Act 3. Check 2. Do Execute the change. Study the results; did it work? Lin/Operations/Quality
Quality Wireless (A): Checking for Improvement • Performance in April 2005: Mean = 79.50, Standard deviation = 16.86 • What is the probability of observing such a sample if performance has not improved relative to 2003-04? • Mean hold in 2003-04 = 99.67 • Standard deviation = 24.24 • Given that April 2005 had 30 days, we need to consider distribution of samples of size 30. The standard deviation of sample means = 24.24/√30 = 4.43 • Probability of observing a sample of size 30 with mean 79.50 or less = NORMDIST(79.50, 99.67, 4.43, 1) = 2.64E-06 Lin/Operations/Quality
Process Quality & Improvement Module • Quality & the Voice of the Customer • What is Quality? • Quality Programs in practice • Voice of the Customer • Process Capability and Improvement • Process Capability • Checking for Improvement (Quality Wireless) • Voice of the Process • Process Variability • Statistical Process Control (SPC) • Quality Wireless (B) • Why 6-Sigma? • Flyrock Tires Lin/Operations/Quality
Has Process Performance Changed? Quality Wireless (B) • Average hold time from September 1-10 =86.6 seconds • Ray yells at supervisors • Performance improves from September 11-20 to an average hold of 74.4 seconds • What do you think of Ray’s management style? Lin/Operations/Quality
Performance of Inventory Manager WIP Award Given month J F M A M J J A S O N WIP Manager repents and kicks... month J F M A M J J A S O N D J F WIP .. and concludes that kick ... mgt works !? J F M A M J J A S O N D J F M A M J month Lin/Operations/Quality
Source of Variability • Inherent (common cause) • External (assignable cause) • Objective: Identify inherent variability and eliminate external variability. A process is in control if it has only inherent variability. • To improve the system, attack common causes (methods, people, material, machines). This is the role of management. Lin/Operations/Quality
Statistic Process Control – Quality Wireless (B) • After the improvements, daily hold time has an average of 79.50 and a standard deviation of 16.86. • Since we are considering samples of size 10 (10 days), we need to consider the distribution of sample means. Sample means have an average of 79.50 and a standard deviation of 16.86/√10 = 5.33. • Probability of observing 86.6 or higher even if process is in control = 1-NORMDIST(86.6, 79.50, 5.33, 1) = 0.0915 Lin/Operations/Quality
SPC – Quality Wireless (B) • Probability of observing 74.4 or lower even if process is in control = NORMDIST(74.4, 79.50, 5.33, 1) = 0.1693 • What we need is a hypothesis test each time we observe a sample – Does the sample belong to the in-control population or not? Lin/Operations/Quality
SPC – Setting Control Limits • Upper Control Limit = UCL = Mean + 3σXbar • Lower Control Limit = LCL = Mean - 3σXbar • In the case of Quality Wireless • UCL = 79.50 + 3×5.33 = 95.49 • LCL = 79.50 - 3×5.33 = 63.51 • The process was in control when samples with means of 86.6 and 74.4 were observed. Lin/Operations/Quality
Voice of the Process:Key Learning Objectives • The role of variability in evaluating performance • A process • in control has only inherent (from common cause) variation • out of control has variation from an assignable cause • SPC framework for process control and improvement Lin/Operations/Quality
Process Quality & Improvement Module • Quality & the Voice of the Customer • What is Quality? • Quality Programs in practice • Voice of the Customer • Process Capability and Improvement • Process Capability • Checking for Improvement (Quality Wireless) • Voice of the Process • Process Variability • Statistical Process Control (SPC) • Quality Wireless (B) • Why 6-Sigma? • Flyrock Tires Lin/Operations/Quality
Why 6-Sigma? • 2 sigma: • 69.146% of products and/or services meet customer requirements with 308,538 defects per million opportunities. • 4 sigma: • 99.379% of products and/or services meet customer requirements ... but there are still 6,210 defects per million opportunities. • 6 sigma: • 99.99966% – As close to flaw-free as a business can get, with just 3.4 failures per million opportunities (e.g. products, services or transactions). Lin/Operations/Quality
Probability that process/product meets specs 100.0% 10.0% 3 -sigma 1.0% 4 - sigma 5 - sigma 0.1% 6 - sigma 0.0% 0.0% 1 10 100 1000 10000 100000 1000000 # steps/components Why 6-Sigma? • Impact of # of parts/stages in a process Lin/Operations/Quality
LSL USL LSL USL s = 5 s = 10 130 160 130 160 100 100 LSL USL LSL USL s = 5 s = 10 143 160 100 100 160 143 Why 6-Sigma? Robustness to Mean Shifts 99.9 % 99.9 % Lin/Operations/Quality
Why 6-Sigma? 6-Sigma Quality at Flyrock At the extruder, the rubber for the AX-527 tires had thickness specifications of 400 10. Susan and her staff had analyzed many samples of output from the extruder and determined that if the extruder settings were accurate, the output produced by the extruder had a thickness that was normally distributed with a mean of 400 and a standard deviation of 4. If the setting is accurate, what proportion of the rubber extruded will be within specifications? Lin/Operations/Quality
Process Capability: Sigma Capability • Sigma capability is the number of standard deviations from the mean to the closest specification limit. • Sigma capability of extrusion process = Susan has asked operators to take a sample of 10 sheets of rubber each hour from the extruder and measure the thickness of each sheet. Based on the average thickness of this sample, operators will decide whether the extrusion process is in control or not. Given that Susan plans 3-sigma control limits, what upper and lower control limits should she specify to the operators? Lin/Operations/Quality
Impact of Mean Shift • If a bearing is worn out, the extruder produces a mean thickness of 403 when the setting is 400. Under this condition, what proportion of defective sheet will the extruder produce? • Assuming the earlier control limits, what is the probability that a sample taken from the extruder with the worn bearings will be out of control? • On average, how many hours are likely to go by before the worn bearing is detected. Lin/Operations/Quality
Why 6-Sigma? Rapid Detection • What if extrusion is to become a 6-Sigma process? • Target mean = • Target standard deviation = • Process improvement has resulted in the extrusion process having a mean of 400 and a standard deviation of 1.667. What should the new control limits be? What is the proportion of defectives produced? Lin/Operations/Quality
Improving Process Capability • Return to the case of the worn bearing where extrusion produces a mean thickness of 403 when the setting is 400. Under this condition, what proportion of defective sheets will the extruder produce (for the 6-sigma process)? • Assuming the new control limits, what is the probability that a sample taken from the extruder with the worn bearings will be out of control? • On average, how many hours are likely to go by before the worn bearing is detected. Lin/Operations/Quality
Key Learning Objectives: Process Quality • Specification limits: Voice of the customer • Process capability is a measure of the quality delivered (external): links VoP with VoC • Improving capability may require variability reduction and/or mean shift • Control limits used to verify if process is in control (internal), i.e., is maintaining capability: Voice of the process • Higher process capability reduces defectives and speeds up detection of assignable cause Lin/Operations/Quality