What Scientists Do
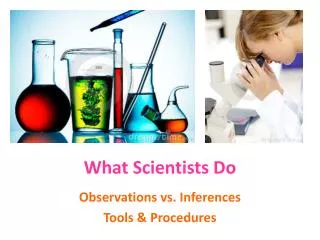
What Scientists Do. Observations vs. Inferences Tools & Procedures. Observation vs. Inference. Scientists use observations to gather data (using the 5 senses). Scientists use known data to make inferences (a logical interpretation of the data based on past experiences).

What Scientists Do
E N D
Presentation Transcript
What Scientists Do Observations vs. Inferences Tools & Procedures
Observation vs. Inference • Scientists use observations to gather data (using the 5 senses). • Scientists use known data to make inferences (a logical interpretation of the data based on past experiences).
There are 2 doors. • Observation • Inference Observation!
They’re fighting, because someone ate their cookies. • Observation • Inference Inference!
They’re hitting each other hard. • Observation • Inference Inference!
What do scientists do?Basic Skills of a Scientist: • Observing: noting the properties of objects & situations using the 5 senses • Classifying: relating objects & events according to their properties or attributes • Space/Time Relations: visualizing & manipulating objects & events, dealing with shapes, time, distance, & speed
What do scientists do?Basic Skills of a Scientist: • Using Numbers: using quantitative relationships (scientific notation, error, significant numbers, precision, ratios, & proportions) • Measuring: expressing the amount of an object or substance in quantitative terms (meters, liters, grams, etc.) • Inferring: giving an explanation for an object or event • Predicting: forecasting a future occurrence based on past observations or the extension of data
What do scientists do?Integrated Skills of a Scientist: • Defining Operationally: developing statements that present a concrete description of an object or event by telling one what to do or observe • Formulating Models: constructing images, objects, or mathematical formals to explain ideas • Controlling Variables: manipulating & controlling properties that relate to simulations or events for the purpose of determining causation in experimental research design
What do scientists do?Integrated Skills of a Scientist: • Interpreting Data: arriving at explanations, inferences, or hypotheses from data that have been graphed or placed in a table (usually involves concepts such as mean, mode, median, range, frequency, distribution, etc.) • Hypothesizing: stating a tentative generalization of observations or inferences that may be used to explain a relatively larger number of events, but that is subject to immediate or eventual testing by 1 or more experiments • Experimenting: testing a hypothesis through the manipulation & control of an independent variable & noting the effects on a dependent variable; interpreting & presenting results in the form of a report that others can follow to replicate the experiment
Tools & Procedures • Biologists use metric measurements (the SI system) to gather & interpret data! • SI is the universal measurement system!
Conversions • The metric system is the universal measurement system based on the number 10. • The meter is the distance value. • The gram is the mass value. • The liter is the volume value.
Conversions • If you want to change a larger unit into a smaller unit, move the decimal point to the right. • If you want to change a smaller unit to a larger unit, move the decimal point to the left. • 100 g = _____ kg • 0.0074 kL = _____ L .1 7.4
Scientific Notation • Used to make very large or very small numbers easier to read • Numbers that are very small have negative exponents. • Numbers that are very large have positive exponents.
Scientific Notation • The goal is to have a single non-zero number (1-9) to the left of the decimal & the exponent at the end tells you how many decimal places over & in which direction you would move to get to the original number. • It is really only useful if it will make the number shorter. If the number does not have several zeros in front or behind the number taking up space, SN will only make the number longer. • Keep this in mind when converting!
Scientific Notation • 0.0000000001 kg is easier to read as 1.0 x 10⁻¹⁰ kg • 1094600000 cm is easier to read as 1.0946 x 109 cm • 1980084600000 g = _____________________ • 0.00034568 cm = _______________________ • 14698 g = _____________________________ 1.9800846 x 10¹² 3.4568 x 10⁻⁴ 14698
Graphing • How a scientist shows patterns in data • Several types of graphs – not all of them useful for data communication • Line Graphs • Bar Graphs • Pie Chart
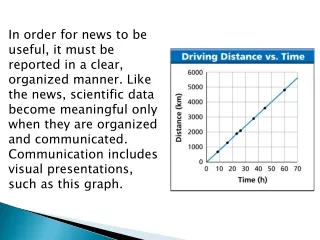
Graphing • Line Graph: compares 2 things in which items on 1 axis affect the items on the other axis • If you’re comparing anything to time, it is usually a line graph! • Example: amount of CO2 in the atmosphere over the last 6 decades
Graphing • Bar Graph: compares 2 or more values • Example: number of students with red hair in each class
Graphing • Pie Chart: effective in showing proportions or percentages of a whole thing • Example: comparing the percentage vote that each candidate received in an election
Graphing • Always draw lines with a ruler, use pencil, & use colored pencils when necessary. • Graphs must include: • Title: tell what you are comparing or displaying • X-axis: label & give scale • Y-axis: label & give scale • Key: give meanings of symbols & colors used • Data points: clearly marked & label them if there are no grid lines
Microscopes • Biologists use microscopes to see living things that are too small for the unaided eye. • 2 basic types: • Light Microscopes • Electron Microscopes
Light Microscopes • Produce magnified images by focusing visible light rays • Magnifies up to 1000x
Electron Microscopes • Produce magnified images by focusing beams of electrons • Used to magnify tens & hundreds of thousands of times for extremely small objects like viruses The hair on the leg of a fly(magnified by a factor of 1000)! Salt crystals on the antennae of an insect (magnified by a factor of 5000)!
Other Techniques & Tools • Cell Cultures: in order to study cells under a controlled condition, a biologist can take a single cell & place it in a Petri dish with nutrient solution to help the cell regenerate & fill the whole dish! • This cell culture can be used to isolate a single type of cell, or study interactions between cells & chemicals!
Other Techniques & Tools • Cell Fractionation: in order to study a single part of a cell, the cells can be lysed (burst open) & the broken cells can be added to a liquid & placed in a tube. • This tube can be placed in a centrifuge, which spins the tubes at high speeds. • This causes cell parts to settle at different levels based on their density (the densest parts will land on the bottom).
Other Techniques & Tools • Autoclave: in order to sterilize tools & kill anything a scientist may have been growing to test • The large steel machine uses heat & pressure to raise the temperature to a temperature in which no bacteria, viruses, or spore can survive!
Conversions & Graphing Practice • Practice converting meters (unit of length). • Use the data given to create a graph. • Remember! Which type of graph would be most appropriate?