Download
1 / 57
570 likes | 593 Vues
Discover the fascinating world of neutrinos through the Super-Kamiokande project, unravelling mysteries from solar phenomena to atmospheric oscillations. Follow the journey of detecting neutrinos, understanding neutrino oscillations, and interpreting crucial data to solve one of the universe's greatest puzzles.

E N D
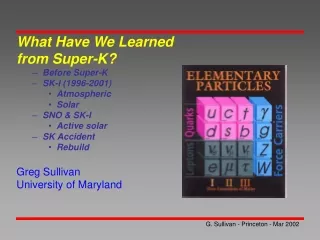
What Have We Learned from Super-K? • Before Super-K • SK-I (1996-2001) • Atmospheric • Solar • SNO & SK-I • Active solar • SK Accident • Rebuild Greg Sullivan University of Maryland
Why Super-Kamiokande? • Solar Neutrinos “Problem” • 3 experiments showed a deficit of solar neutrinos. • Going back ~30 years • About ½ of the expected number were observed • results can not be reconciled with the standard solar model • Atmospheric Neutrino “Anomaly” • IMB and Kamiokande saw less than expected ratio of nm/ne • One Proposed Explanation was: Neutrino Oscillations • Solar neutrinos might be ne -> nm • Atmospheric neutrinos might be nm -> nt
Neutrino Oscillations • If neutrinos oscillatethen “mixing” must occur between different type of neutrinos. Weak eigenstates of the neutrino are mixtures of the neutrinos with definite mass. • n mass is not 0 and flavor is not absolutely conserved! • Probability of electron neutrino to remain electron flavor • Matter Effects will alter this vacuum expression • MSW effect
Super-Kamiokande Detector • Detector Characteristics • 41 m h x 39 m dia. • 50,000 ton (22,000 ton fiducial) • 11,200 20” PMTs inner detector • 1,850 8” PMTs anti-detector • 40% photo-cathode coverage
Detecting neutrinos Cherenkov ring on the wall Electron or muon track The pattern tells us the energy and type of particle We can easily tell muons from electrons
Atmospheric Neutrino Production Ratio predicted to ~ 5% Absolute Flux Predicted to ~20% :
about 15 km about 13,000 km Atmospheric Oscillations We look for n transformations by looking at ns with different distances from production SK Neutrinos produced in the atmosphere
n - e e + W n p Atmospheric Neutrino Interactions Reaction Thresholds Electron: ~1.5 MeV Muon: ~110 MeV Tau: ~3500 MeV Neutral Current Charged Current
Telling particles apart Muon Electron
Muon - Electron Identification PID Likelihood sub-GeV, Multi-GeV, 1-ring Monte Carlo (no oscillations) We expect about twiceas many nm as ne
Super-K Atmospheric Data Set • 1289.4 days of data (22.5 kilotons fiducial volume) • Data Set is divided into: • Single and Multi Ring events • Electron-like and Muon-like • Energy Intervals • 1.4 GeV< Evis >1.4 GeV • Also Evis< 400MeV (little or no pointing) • Fully or partially contained muons (PC) • Upward going muons - stopping or through going • Data is compared to Atmospheric Monte Carlo • Angle (path length through earth) • Visible energy of the Lepton
Low Energy Sample No Oscillations Oscillations (1.0, 2.4x10⁻³eV2)
Multi-GeV Sample No Oscillations Oscillations (1.0, 2.4x10⁻³eV2) Down UP Down UP going
Summary of Atmospheric Results Compelling evidence for nm to nt atmospheric neutrino oscillations Best Fit for nmto nt Sin22q =1.0, DM2=2.4 x 10⁻³eV2 c2min=132.4/137 d.o.f. No Oscillations c2min=316/135 d.o.f. 99% C.L. 90% C.L. 68% C.L. Best Fit
Tau’s require greater than 3 GeV in neutrino energy This eliminates most events Three correlated methods were used All look for enhanced upward going multi-ring events All show slight evidence for Tau appearance None are statistically significant Tau Appearance?
The p0 sample • For nmto ns the rate of NC events is reduced as compared to nmto nt which is the same as no oscillations. • The SK NC enriched sample is only about 1/3 from NC interactions. • The p0 sample is the cleanest NC signal • Until K2K the error in s(p0)(~1-2 Gev) has been as large as the effect!
Oscillation Parameter Space LMA SMA LOW VAC
Expected Day – Night Asymmetry Bahcall
n e - e - W n - e e Charged Current n (electron ’s only) Solar Neutrinos in Super-K • The ratio of NC/CC cross section is ~1/6.5
Solar Neutrinos in Super-K • Super-K measures: • The flux of 8B solar neutrinos (electron type) • Energy, Angles, Day / Night rates, Seasonal variations • Super-K Results: • We see the image of the sun from 1.6 km underground • We observe a lower than predicted flux of solar neutrinos (45%)
Solar Neutrinos SSM: Bachall 2000 Flux: 8B 5.05x10⁶ /cm2/s Spectrum Ortiz et al Toward Sun From Sun
SNO measures just ne SK measures mostly ne but also other flavors (~1/6 strength) From the difference we see oscillations! This is from nm & nt neutral current } SNO Results - Summer 2001
Combining SK and SNO • SNO measures Fne= (35 ± 3 )% Fssm • SK Measures Fes= (47 ± .5 ± 1.6)% Fssm • No Oscillation to active neutrinos: • ~3s difference • If Oscillation to active neutrinos: • SNO Measures just Fne • This implies that Fnm,t= ~65% Fssm (~2/3 have oscillated) • SK measures Fes =(Fne + (Fnm,t)/6.5) • Assuming osc. SNO predicts that SK will see Fes ~ (35%+ 65%/6.5) Fssm = 45% ± 3% Fssm
Super-K Disaster - Nov 12, 2001 • Chain reaction destroyed 7000 ID and 1000 OD Tubes • The cause is not completely understood, but it started with a bottom pmt collapse. • The energy release comes from a 4 T column of water falling • There are plans to rebuild…