Download
1 / 79
840 likes | 1.26k Vues
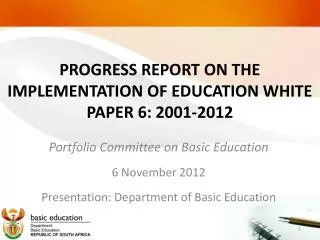
PROGRESS REPORT ON THE IMPLEMENTATION OF EDUCATION WHITE PAPER 6: 2001-2012. Portfolio Committee on Basic Education 6 November 2012 Presentation: Department of Basic Education. OUTLINE OF THE PRESENTATION. Purpose Background Understanding inclusion Barriers to learning

E N D
PROGRESS REPORT ON THE IMPLEMENTATION OF EDUCATION WHITE PAPER 6: 2001-2012 Portfolio Committee on Basic Education 6 November 2012 Presentation: Department of Basic Education
OUTLINE OF THE PRESENTATION • Purpose • Background • Understanding inclusion • Barriers to learning • Roles and responsibilities of DBE and PEDs • Policy Directives: Education White Paper 6 • Focus on DBE Deliverables
OUTLINE OF THE PRESENTATION cont... • Focus on Deliverables by PEDs • PEDs’ Dashboard on the implementation of Inclusive Education Policy • What has not been done by PEDs? • What has not been done by DBE? • Key strategic levers for DBE to improve the implementation of WP6 • Key strategic levers for PEDs to improve the implementation of WP6 • Risks, root causes and mitigation strategies
PURPOSE • To present a comprehensive progress report on the implementation of the Inclusive Education Policy • To identify and isolate challenges, gaps and mitigation strategies to address the identified challenges and gaps • To foster a harmonised conceptualisation of the Inclusive Education Policy and its intentions • To put test and evaluate the widely held view both within the Department and the general public that the Inclusive Education Policy has failed
BACKGROUND • HEDCOM and CEM directed that special attention be focused on the implementation of the Inclusive Education Policy • The meeting between the Deputy Ministers of DWCPD and DBE also underscored the directive of HEDCOM and CEM • During its workshop of 25-27 July 2012 the Portfolio Committee on Basic Education directed that DBE develops a comprehensive report on the implementation of Inclusive Education Policy since its launch in July 2001 • The need for developing a comprehensive report on Inclusive Education further followed from the PC for DWCPD’s request to DBE for responses to concerns and questions raised during public hearings on the implementation of the UN Convention on the Rights of People with Disabilities that were conducted on 25-26 July 2012
UNDERSTANDING INCLUSION “a process of addressing and responding to students’ diversity by increasing their participation in learning, cultures and communities, and reducing exclusion within and from education” (UNESCO, November 2008)
BARRIERS TO LEARNING • Barriers to learning refer to difficulties that arise within the education system as a whole , the learning site and/or within the learner, which prevent access to learning and development for some learners. • Systemic barriers • Societal barriers • Pedagogical barriers • Intrinsic barriers • Reducing barriers to learning and accessing education requires Integrated and Multidisciplinary Approach
POLICY DIRECTIVES: EDUCATION WHITE PAPER 6 • Education White Paper 6 isolates the following Directives in implementing Inclusive Education Policy: • Building capacity in all education departments • Establishing district support teams • Identifying, designating and establishing full-service schools • Establishing institution-level support teams • Establishing mechanisms for the early identification of learning difficulties • Developing the professional capacity of all educators in curriculum development and assessment • Mobilizing public support • Developing an appropriate funding strategy
FOCUS ON DBE DELIVERABLES WHAT HAS DBE ACHIEVED OVER THE YEARS?
DBE’S PROGRESS OVER THE YEARS • Piloted the implementation of WP6 through a Field Test in 30 districts, 30 special schools and 30 designated full service schools • Solicited donor funding for the Field Test from Finland and Sweden amounting to R54m • Developed the screening, identification, assessment and support (SIAS) strategy for early identification of learning difficulties and support • Developed Inclusive Learning Programmes to guide the system on how to deal with disabilities in the classroom • Developed Funding Principles to guide PEDs on how to fund the implementation of WP6 as interim measure • Submitted two funding bids to Treasury for the Expansion of Inclusive Education Programme from which R1.5bn was allocated for 2008 MTEF and R300m for 2009 MTEF on Equitable Share basis
DBE’S PROGRESS OVER THE YEARS cont.. • Developed Business Plan Development guidelines for PEDs for Expansion of IE Programme • Developed Guidelines for Full Service/Inclusive Schools • Developed Guidelines to Ensure Quality Education and Support in Special Schools and Special School Resource Centres • Developed guidelines for implementing concessions throughout the grades • Audited all special schools for the Blind to develop an intervention strategy to improve quality of teaching and learning in those schools • Ran an R18m tender to procure assistive devices and technology to 33 special schools and 10 full service schools to model the provision • Reviewed the Inclusive Learning Programmes to Guidelines for Inclusive Teaching and Learning
DBE’S PROGRESS OVER THE YEARS cont.. • Converted 10 ordinary schools to full service schools as a model for R11m • Incorporated inclusivity principles in all CAPS • Audited reform schools and schools of industry as part of their transfer to DSD • Trained 200 district officials including SMTs in Visual impairment as well as in Deaf Education • Developed the Inclusive Education Strategy that is currently implemented
DBE’S PROGRESS OVER THE YEARS cont.. • Developed Guidelines for Responding to Learner Diversity in the Classroom through the National Curriculum Statement and orientated 2 474 district officials and grade 10 subject advisors in 2011; 110 stakeholders in 2011; 3 035 district officials and subject advisors for grade 11 in 2012; 163 stakeholders and special schools lead teachers in 2012 and 968 district officials and subject advisors for grades 4-6 in 2012 • Is developing the South African Sign Language curriculum as subject for grades R-12 • Has developed a framework for qualifications pathways at NQF level 1 for learners with moderate and severe intellectual disability • Is developing an Action Plan to provide access to education for out-of-school children and youth including severe and profoundly intellectually disabled ones
FOCUS ON DELIVERABLES BY PEDS WHAT HAVE PEDS ACHIEVED OVER THE YEARS?
INCLUSIVE EDUCATION & SPECIAL NEEDS BUDGET ALLOCATION FOR 2012/13 PER PROVINCE
INCLUSIVE EDUCATION & SPECIAL NEEDS BUDGET ALLOCATION FOR 2012/13 PER PROVINCE • The budget for the Inclusive Education policy implementation should allocate to Special Schools (Programme 4) as well as the Expansion of Inclusive Education Programme • Current Treasury Budget Structure makes provision for only Special Schools • Only FS, KZN, NW and WC allocate for both sub-components with KZN allocating the highest (R388m) for 2012/13, followed by WC (R68.2m), NW (R49.8m) and FS (R6.7m) • Other five provinces (EC, GP LP, MP and NC) top-slice from Programme 4 for some activities of Expansion of IE Programme – thus making slow progress in implementing the IE policy • Of the R5.5bn allocated for 2012/13 only R463m is for Expansion of IE • Challenge: Five provinces have not appropriated funding for the Programme on the Expansion of Inclusive Education resulting in serious backlogs in those provinces regarding the implementation of the policy in its entirety
PROFILING DISABILITIES: SPECIAL SCHOOLS, LEARNERS AND TEACHERS PER PROVINCE, EMIS 2009
PROFILING DISABILITIES: SPECIAL SCHOOLS, LEARNERS AND TEACHERS PER PROVINCE, EMIS 2009 • Special schools like ordinary schools belong to PEDs • Special schools roles according to WP6 are to admit children with severe and profound disabilities and to play the role of Resource Centres • Majority of special schools have long waiting lists of children awaiting admission for which PEDs need to put mechanisms in place and support districts in finding learning spaces for such children • Analysis: • 2009 data revealed that GP had the largest number of special schools followed by WC and the KZN • Special schools were the lowest in LP and NC, each having 10 • In total, there were 111 619 learners with disabilities accessing education in special schools
PROFILING DISABILITIES: SPECIAL SCHOOLS, LEARNERS AND TEACHERS PER PROVINCE, EMIS 2009 • Challenges: • Most special schools battle with governance and management matters especially financial management thus requiring same attention and support as ordinary schools • There is very limited access to education for Autistic children across provinces and affected parents have to send them to private schools with unaffordable fees • Physically disabled and incontinent learners are not adequately provided for in special schools
PROFILING DISABILITIES: LEARNERS WITH DISABILITIES IN ORDINARY SCHOOLS PER PROVINCE, EMIS 2009
PROFILING DISABILITIES: LEARNERS WITH DISABILITIES IN ORDINARY SCHOOLS PER PROVINCE, EMIS 2009... • Guidelines for Full Service Schools, screening, identification, assessment and support (SIAS) and for Responding to Learner Diversity in the Classroom through the NCS (Curriculum Differentiation) are key in providing responsive support to learners • Findings: • Of the 124 559 learners admitted to ordinary schools in 2009, 21 976 (17.6%) were in separate classes • The separate classes are called different things in different provinces • The phenomenon of special classes much as it serves integration which precedes full inclusion are problematic as they are anti-inclusion
PROFILING DISABILITIES: LEARNERS WITH DISABILITIES IN ORDINARY SCHOOLS PER PROVINCE, EMIS 2009... • Challenges: • The “permanency” factor attached to special classes/units is problematic as learners stay in those classes throughout their schooling years • Inherent labelling and stigmatisation of learners placed in special classes
PROFILING DISABILITIES: LEARNERS PER CATEGORY OF DISABILITY PER PROVINCE, EMIS 2009
FURTHER BREAKDOWN OF DISABILITY PER CATEGORY PER PROVINCE, EMIS 2011
PROFILING DISABILITIES: LEARNERS PER CATEGORY OF DISABILITY PER PROVINCE, EMIS 2009 • Findings: • Moderate Intellectual Disability (MID) accounts for 27.3% of learners in special schools, Severe Intellectual is second with 23.1% followed by Specific Learning Disabilities e.g. Dyslexia, which account for 12.8% • As much as Blindness and Deafness accounted for 0.9% and 6.1% respectively, they require a lot of expertise including the adaptation of materials
PROFILING DISABILITIES: LEARNERS PER CATEGORY OF DISABILITY PER PROVINCE, EMIS 2009 • Challenges: • Though Autistic Spectrum Disorder (Autism) affected 1.7% of learners with disabilities in 2009, it is the most complicated yet very less provided for in the system • Learners with Cerebral Palsy are not adequately provided for both in terms of incontinence facilities and in terms of personal support personnel • Moderately and Severely Intellectually Disabled (SID) learners (in the majority of disabilities) are victims of “push-out” tendencies of ordinary/mainstream schools and walk away with school reports which are both not accredited and not recognised by recognised by the world of work
INDICATORS FOR MEASURING PROGRESS • Strengthen special schools – neglected special schools per 2002 Audit • Conversion of special schools to Resource Centres • New special schools that have been/are being built • Assistive devices and technology procured for special and full service schools • Specialist professionals (therapists, psychologists, etc) employed • Remedial teachers, special needs teachers etc. employed in special schools • Remedial teachers, special needs teachers etc. employed in Full Service Schools • Teachers without requisite qualifications in special schools
INDICATORS FOR MEASURING PROGRESS • Ordinary schools converted to Full Service Schools without infrastructure upgrade • Ordinary schools converted to Full Service Schools through infrastructure upgrade • Teachers trained in Inclusive Education-related activities • Inclusive Education staff establishment • Composition of functional district-based support teams (DBSTs) that have been established
STRENGTHENED SPECIAL SCHOOLS... • Audit of all special schools in 2002 found 135 special schools highly neglected and dysfunctional requiring strengthening • Neglect led to high incidents of learner abuse, buildings falling apart especially hostels, no effective teaching and learning, no appropriate and effective support to learners etc • To date 295 special schools have been strengthened through almost R1bn spending • Rural-urban divide, competing priorities and legacy of the past impacted progress differently: • EC and LP strengthened more schools (42 and 34 respectively) spending less budget of R38m and R43m compared to FS (19 schools) and WC (16 schools) which spent R71m and R41m respectively • GP (73 schools) and KZN (71 schools) strengthened same number of schools spending R60m and R638m respectively
SPECIAL SCHOOLS CONVERTED TO RESOURCE CENTRES TO DATE... • Converting special schools to Resource Centres as WP6 strategy entails targeting SSs for devoted resourcing with dedicated funds to extend specialized services to other schools within the district • This driven with the Expansion of Inclusive Education Programme (EIEP) funded by Treasury through Equitable Share of R1.5bn (2008 MTEF) and R300m (2009 MTEF) • Current Treasury Budget Structure only allocates budget to SSs, a sub-component of IE Policy through Programme 4
SPECIAL SCHOOLS CONVERTED TO RESOURCE CENTRES TO DATE... • EC, GP, LP, MP, and NC have never allocated funding for both MTEF cycles leading to top-slicing of Programme 4 for IE activities and the following variations in progress made: • Allocation for EIEP factor: KZN (14 RCs: R427m) and WC (24 RCs: R44m) progressed by far compared to EC (3 RCs: R2m) and FS (3 RCs: R0.3m) for example • Current Treasury Budget Structure: through top-slicing from Programme 4, LP (6 RCs: R46m) and NC (4 RCs: R99m) spent more than WC(24 RCs: R44m) without EIEP allocation
NEW SPECIAL SCHOOLS BUILT/BEING BUILT PER PROVINCE... • Some PEDs conducted feasibility studies for possibly building new SSs • One of strategies to increase access to education for out-of-school children and youth of school-going age • Since the advent of WP6, 25 new SSs have been/are being built to the value of R787m – some already completed • Majority of new SSs in WC followed by KZN and NW, all three that always allocated budget for Expansion of Inclusive Education Programme – progress ahead of others not surprising • However infrastructurenorms/guidelines for SSs do not exist yet • To be noted: on average one SS cost R100m to build from scratch
SPECIAL AND FULL SERVICE SCHOOLS THAT RECEIVED ASSISTIVE DEVICES AND TECHNOLOGY
SPECIAL AND FULL SERVICE SCHOOLS THAT HAVE RECEIVED ASSISTIVE DEVICES AND TECHNOLOGY... • Assistive devices and technology mediate the impact of disability to enhance learning and development • These include: spectacles, hearing aids, cochlea implants, wheelchairs, white boards, Perkins Braillers, white canes, Bookmakers, Augmentative and Alternative Communication devices (AAC), etc. • DoH and DBE are responsible for health-related devices and curriculum-specific devices respectively • DBE currently provides both categories • SSs are provided through Programme 4 whilst FSSs are provided though Expansion of Inclusive Education Programme or top-slicing from Prog. 4
SPECIAL AND FULL SERVICE SCHOOLS THAT HAVE RECEIVED ASSISTIVE DEVICES AND TECHNOLOGY... • Findings: • A total of 435 FSSs have received and the majority is in NW (112 – 25.7%) followed by WC (108 – 24.8%); MP (89 – 20.5%); and KZN (73 – 16.8%) • Highest expenditure in KZN (R497m) followed by NW (R37m); WC (R19m); and GP (R16m) • Challenge: No Government-determined Coordinating Framework to provide access
SPECIALIST PROFESSIONALS CURRENTLY EMPLOYED... • Availability of specialists are central in the early identification of barriers to learning and for the implementation of SIAS • Availability of therapists is critical for assessment of learners for provision of assistive devices and technology particularly for physical disability • Creation of these posts would be possible by the Expansion of IE Programme allocation
SPECIALIST PROFESSIONALS CURRENTLY EMPLOYED... • Findings: • Analysis found glaring disparities in the provision of access to specialist services to schools across provinces and within each in terms of types of the professionals • 1 767 SSs and FSSs have access to specialist professionals – WC (86.5%) the only province providing schools with more access – all others provide access to less than 5% of schools – situation acutely dire in EC (0.5%); LP (0.3%) and NC (0.1%) all three which never budgeted for Expansion of Inclusive Education • Overall availability of health professionals across provinces shows urban-rural slant except in KZN (13,8%) as GP (50,9%) and WC (16,6%) provide more than 10% accessibility to health professionals for their selected schools – thus better reasonably equipped for SIAS implementation • Across the spectrum therapists are the majority (72.2%) followed by professional nurses (10.2%); psychologists (9.0%); and social workers (8.6%) • Challenge: DBE struggles to attract health professionals as they are not paid their OSD yet
REMEDIAL, SPECIAL NEEDS AND LEARNING SUPPORT TEACHERS AND TEACHER ASSISTANTS TO WHICH SPECIAL SCHOOLS HAVE ACCESS • These types of teachers and teacher assistants constitute a support structure during learning and assessment to improve participation and performance • Teachers excluding assistants must be able to differentiate and support teachers with Curriculum Differentiation for example • Except for Learning Support Teachers others are placed at individual schools while the former essentially should be at District and be itinerant to schools
REMEDIAL, SPECIAL NEEDS AND LEARNING SUPPORT TEACHERS AND TEACHER ASSISTANTS TO WHICH SPECIAL SCHOOLS HAVE ACCESS • Findings: • Special schools largely have access to 40.5% Special Needs Teachers followed by access to 27.3% Teacher Assistants/Aides; 27.0% Learning Support Educators and 5.3% Remedial Teachers • NW and WC special schools each provides about 27% access to overall curriculum support followed by KZN with 22.5% while LP and NC provide no curriculum support at all • Challenge: • these curriculum delivery supporters are used differently in different provinces • Majority of SSs are not organized according to grades which impacts on use of Teachers Assistants • Though majority of Teacher Assistants in Schools for the Deaf can sign they are without the NSC
REMEDIAL, SPECIAL NEEDS AND LEARNING SUPPORT TEACHERS AND TEACHER ASSISTANTS TO WHICH SPECIAL SCHOOLS HAVE ACCESS • Findings: • Most provinces provide curriculum support to FSSs except LP, MP and NC and only minimally in FS • Large curriculum support comes from LSEs (46.5%) followed by TAs (26.2%), RTs (15.2%) and finally SNTs (12.1%) • Except for KZN (18.9%) and EC (16.1%) curriculum support to FSSs is the highest in NW and WC, respectively 27.2% • Challenge: • these curriculum delivery supporters are used differently in different provinces • How the specialist teachers are used in most FSSs – learners with learning difficulties are placed in special classes and kept permanently – the practice that is anti-inclusion with possible labelling and stigmatisation
TEACHERS WITHOUT REQUISITE QUALIFICATIONS IN SPECIAL SCHOOLS
TEACHERS WITHOUT REQUISITE QUALIFICATIONS IN SPECIAL SCHOOLS • Visual impairment as well as Deafness are isolated because they are the highly specialised compared to other disabilities which largely depend on Curriculum Differentiation • Findings: • The phenomenon affects 59 SSs (89.4%) of the 66 schools (22 for the Blind and 44 for the Blind) • The proportion of teachers without South African Sign Language knowledge at all (21.3%) is higher than that for teachers without knowledge of visual impairment (10.2%)