Download
1 / 29
290 likes | 785 Vues
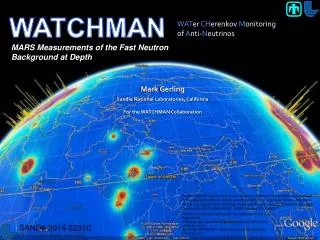
WATCHMAN. WAT er CH erenkov M onitoring of A nti- N eutrinos. MARS Measurements of the Fast Neutron Background at Depth. Mark Gerling for the WATCHMAN Collaboration. Mark Gerling Sandia National Laboratories, California For the WATCHMAN Collaboration.

E N D
WATCHMAN WATer CHerenkovMonitoring of Anti-Neutrinos MARS Measurements of the Fast Neutron Background at Depth Mark Gerling for the WATCHMAN Collaboration Mark Gerling Sandia National Laboratories, California For the WATCHMAN Collaboration Sandia National Laboratories is a multi-program laboratory managed and operated by Sandia Corporation, a wholly owned subsidiary of Lockheed Martin Corporation, for the U.S. Department of Energy’s National Nuclear Security Administration under Contract DE-AC04-94AL85000. SAND Number 2013-9907P This work was performed under the auspices of the U.S. Department of Energy by Lawrence Livermore National Laboratory under contract DE-AC52-07NA27344. Lawrence Livermore National Security, LLC SAND# 2014-2231C
Outline • WATCHMAN Overview • Neutron Backgrounds at Depth • Multiplicity And Recoil Spectrometer Design (MARS) • System Testing and Deployment • Deployment and Results
The WATCHMAN nonproliferation goal: for the first time, demonstrate remote (1-25 km) sensitivity to a reactor with gadolinium doped water • A remote reactor monitoring demonstration is part of the NNSA Strategic Plan Program Highlights • FY12 start for site selection and background estimates • Site has been selected and preliminary detector design nearing completion. • FY14 decision point for full detector, with input from DOE-SC-HEP • FY16 start of construction
The WATCHMAN Collaboration Bernstein, N. Bowden, S. Dazeley, D. Dobie P. Marleau, J. Brennan, M. Gerling, K. Hulin, J. Steele, M. Sweany K. Van Bibber, C. Roecker, T. Shokair R. Svoboda, M. Bergevin, M. Askins J. Learned, J.Murillo S. Dye M. Vagins, M. Smy, Bill Kropp B. Vogelaar, S.D. Rountree, C. Mariani 25 collaborators 2 National Laboratories 6 Universities 15 physicists 5 engineers 2 Post-docs 3 Ph.Ds UC Berkeley UC Davis U of Hawaii Hawaii Pacific SuperKamiokande SNO IMB KamLAND Double Chooz UC Irvine Virginia Tech • Many person-decades of experience with large neutrino detector design and use • Will add ~2-4 more groups for full project
Demonstration (Perry NGS to IMB cavern) Perry Reactor IMB Lake Erie • Perry Reactor Nuclear Generating Station to IMB cavern in the Fairport Salt Mine (Ohio) • 1434 m.w.e. • cavity was 18m x 17m x 22.5m • ~13 km standoff • 3875 MWth 13 km Fairport Mine • Pros • Existing cavern in active mine (IMB). • Ease of access (near Cleveland). • Large depth for low background (more physics overlap). • Cons • Old cavern requires renovation. Cost estimates are being pursued.
WATCHMAN Design WATer CHerenkov Monitoring of Anti-Neutrinos: Detector has target volume of 10.8x10.8 meter right cylinder of 0.1 % gadolinium-doped water (1 kton). Capture locations can be resolved with 1 meter vertex resolution (sigma) virtual fiducial region. 1.0 meter buffer volume outside of fiducial. And 1.5 meter active veto Previous reactor monitoring measurements relied on being situated in close (~25 m) proximity to the reactor.
WATCHMAN Signal • Anti-neutrino undergoes inverse-beta decay. • Observe positron annihilation, 30us later observe the Gd shower. • Exactly two Cerenkov flashes • within ~100 microseconds • Within a ~ 1 cubic meter voxel Preliminary Background/Signal Estimates
WATCHMAN Background Scaling up the detector in order to remotely monitor a reactor from kilometer distances requires an increased understanding of the backgrounds: Fast neutron rate capable of producing two correlated events in a detector. Muongenic beta delayed precursors > 50 MeV n m n m n b 9Li n
Two Backgrounds, Two Detectors WATCHBOY: Radionuclide Detector MARS: Fast Neutron Spectrometer
Neutron Backgrounds at Depth Preliminary kTon water detector simulations Correlated di-neutron events mimic an antineutrino signal. m – Nuclear interactions in the rock produce several 50+ MeV neutrons. (n,kn) reactions in the rock (and/or detector) create a neutron shower. Simulations indicate that 50+ MeV neutrons are most likely to produce di-neutron signatures through 2 meters of water shielding. Rate of double neutrons as a function of incident neutron energy (2m. shield)
Multiplicity And Recoil Spectrometer (MARS) • Design based on the Neutron Multiplicity Meter (NMM) deployed at Soudan • “Sandwich” designed to captured more neutrons • Capture signature - ~8 MeV of gammas from Gd capture. • Recoil signature – direct scintillation light(must cut above ~8 MeV). Plastic scintillator + GdO2 (1%) 12 layer detectors (900 lbs each). Neutron converter - 3,560 lbs of lead in a steel table.
MARS Detector Configuration • Muon veto to reject muogenic neutron production within MARS, tagging muon spallation interactions in the lead. Seven paddles 24”x72”x1” double sided readout. Four bottom Muon tags 12”x12”x2” not shown. Four end caps 28”x31”x2” not shown.
MARS Design 1. 2. 1. 2. Early Simulation Results 1. 2. Two Classes of Events: • Multiplicity: (n,kn) in lead converts >30 MeV neutrons into multiple ~1 MeV neutrons. Number of captures incident µ energy. • Recoil: Direct “Prompt” Energy Depositionscintillation light µ incident energy (sensitive to ~10 MeV – 100+ MeV)
Data Acquisition Data Acquisition utilizes 4x Struck 3316 250MSPS 14-bit VME cards controlled by an external FPGA for synchronized timing and control. All data written out in list mode, with 16x PMT’s from each detector in a dedicated 3316 card. The remaining 22 muon paddle veto channels are distributed through the remaining 2x 3316 cards groups of 4. This logic setup allows for paddle pairs to be controlled with a common threshold. Each 16x detector is triggered if the sum of one of its group of 4 goes above threshold. Veto are arranged to trigger if detectors in the same volume trigger above a threshold, only those channels are read out (pairs and singles only).
System Testing (early 2013) • Detector testing was done in several stages: • PMT on scintillator cell to set gain. • Dark box with LED’s to gauge PMT single PE response and non-linearity. • Single photoelectron response found for each PMT. • Response measured using 4 LEDs over a large dynamic range to quantify non-linearity. • 20% non-linearity at ~1000 p.e. • Full detector geometry with fixed sources to map position sensitivity.
Deployment Location: KURF • Kimballton Underground Research Facility (KURF) • Located inside limestone mine. • Drive-in access to multiple levels from 300 – 1500 meters water equivalent (m.w.e.). • Scientific research facility (at ~1450 mwe) managed by Virginia Tech. • Numerous experiments currently operated by V. Tech. and other institutions (local support). • Expected rates from models were used to estimate dwell times at different KURF locations.
Deployment Depths Initially deployed to level 6 at 600 m.w.e. for ~6 months. Moved to level 2 at 380 m.w.e. (late 2013, early 2014) for ~3 months. Will Deploy at KURF research site at 1,450 m.w.e. for 6-9 months. Locations chosen to map out low overburden (300-600 m.w.e) as well as the now likely WATCHMAN deployment location for Perry (1,500 m.w.e.). Deployed June 2013
Data Analysis Multiplicity Detector Event Prompt Detector Event Energy Energy Energy deposited > 10 MeV Time Time Muon > 200 uS Muon > 200 uS Every other time < 65 uS Prompt events: Larger than 10 MeV energy deposition (higher than Gd capture gamma energy). Multiplicity events: More than 5 correlated hits with more than ~500 keV and less than 10 MeV in each hit. Hits are “correlated” if the time between every other hit within the event is less than 65 uS. Events are rejected within 200 uS of a muon veto tag, or when a muon comes within a multiplicity event.
Preliminary Processed Results Level 6 (600 m.w.e.) Live time ~16.5 days Multiplicity (prompt energy ~1-10 MeV) above 5: 3,894 = ~7,080/month (30days) Prompt (Multiplicity 1-2) and energy above 1 MeV: 9,763 = ~5,370/month
Preliminary Processed Results Level 2 (380 m.w.e.) Live time ~3.3 days Multiplicity (prompt energy ~1-10 MeV) above 5: 1,015 = ~9,236/month (30days) Prompt (Multiplicity 1-2) and energy above 1 MeV: 3,912 = ~35,600/month
Conclusions Wrapping up deployment on level 2 soon and moving to the final location at ~1,500 m.w.e. Further analysis needed to unfold true neutron spectrum utilizing simulations. Current rates seem to match early estimates.
Thank you! Mark Gerling for the WATCHMAN Collaboration
Scintillator Detectors Measured Co-60 Data Background Monte Carlo Simulated Smeared MC • Utilized existing detector components to mitigate uncertainty. • SONGS detector panels: Sheets of 1% Gadolinium paint between layers of 2 cm thick EJ-200 plastic scintillator. • 12 layers total (75 cm x 100 cm) • Previous deployment utilized four 9” PMT’s with acrylic cookies and 4” light guide. ~ 24% energy resolution at 1 MeVee ~10% light collection efficiency ~1.5 MeVee threshold
Design Modifications for MARS • Converted to utilize 16 - 5” ADIT PMT’s on each detectors to improve uniformity of photocathode coverage and linearity at high energies. • Initial Photon Simulation Results: • 100,000 optical photon simulation (~10 MeVee) • ~22% light collection efficiency • ~10% position variation • ~10% non-linearity at ~1000 PE • Expected linear response up to ~36 MeVee at the center and ~10 MeVee at the edges.
Geant4 Simulation Initially simulate flat energy distribution of fast neutrons from cavern walls In the future simulate muon propagation through rock layer around cavern folding in overburden Model response will be used to unfold energy spectra using experimental data using Maximum Likelihood Estimation Maximization (MLEM).
Goal: Remote Monitoring Stand-off distance (1/r2) Generally closer is better // Reactor power and duty cycle (signal) // Depth (shielding from muogenic backgrounds) • Existing holes in ground preferred • Existing infrastructure desirable • “Remote” detection must be defined: • Outside of facility. • Prove scalability for larger stand-off. • “Monitoring” must be defined: • Reactor state through one fueling cycle. • Detector scale (mass and efficiency) • Cavern composition