Download

1 / 16
160 likes | 332 Vues
CountryData workshop: Building Better Dissemination Systems for National Development Indicators. Differences between national and international reported indicators BY Joseph C. Kamara Liberia Institute of Statistics & Go Information Services (LISGIS) 24 TH April 2014. INTRODUCTION.

E N D
CountryData workshop: Building Better Dissemination Systems for National Development Indicators Differences between national and international reported indicators BY Joseph C. Kamara Liberia Institute of Statistics & Go Information Services (LISGIS) 24TH April 2014
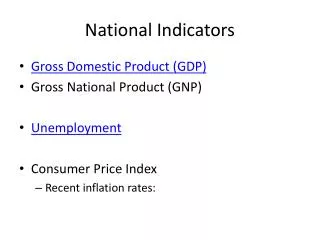
INTRODUCTION The purpose of this presentation is to investigate the available metadata, and identify reasons for differences between national and international reported indicators, To accomplish this investigation, we first consider the indicator, look at the national and international definition, methodology, data source of both and compare them. This will help us to identify the differences, and discrepancies between them, and as a consequence, be in a better position to narrow down those differences and discrepancies that exist.
INDICATOR #1. Births attended by skilled health personnel (National Definition) Among women age 15-49 who had a live birth, the percentage who received prenatal care from a skilled health provider and delivered in a health facility. (International Definition) Percentage of births attended by skilled health personnel (doctors, nurses or midwives) is the percentage of deliveries attended by health personnel trained in providing life saving obstetric care, including giving the necessary supervision, care and advice to women during pregnancy, labour and the post-partum period; conducting deliveries on their own; and caring for newborns. (Traditional birth attendants, even if they receive a short training course, are not included).
(National Methodology/computation) Women age 15-49 with a live birth attended by a skilled staff during delivery is expressed as a percentage of all women age 15-49 with a live birth in the same period. (International Methodology/computation) The number of women aged 15-49 with a live birth attended by a skilled health personnel (doctors, nurses or midwives) during delivery is expressed as a percentage of women aged 15-49 with a live birth in the same period. -Differences All live birth that falls in the five years preceding the survey are among those included for women between 15 – 49 years. Additionally, there are differences in training of health personnel making it difficult to standardize the definition of skilled health personnel. This also makes it difficult to standardize the definitions of doctors, nurses, midwives and substitute midwives. -Discrepancies In terms of survey data, some survey reports may present a total percentage of births attended by a skilled health professional that does not conform to the MDG definition (e.g., total includes provider that is not considered skilled, such as a community health worker) National database included other skilled attendant not included in international birth.
INDICATOR #2. Literacy rate (National Definition) Literacy rate is the percentage of the population age 10 years an above who can read and write a simple sentence in any language (International Definition) Literacy rate of 15–24 year-olds, or the youth literacy rate, is the percentage of the population aged 15–24 years who can both read and write with understanding a short simple statement on everyday life. (National Methodology/computation) Literacy rate is measured as the number of persons age 10 years and above who can read and write in any language, divided by the total population of persons in the same age group multiplied by 100
(International Methodology/computation) Literacy rates are computed by dividing the number of people aged 15–24 years who are literate by the total population in the same age group, the result is then multiplied by 100. (National Data source-comments and limitations) Censuses, surveys and administrative records. (International Data Source comments and limitations) Censuses and surveys
-Differences • Country figure is from the Multiple Indicator Cluster Survey (MICS) administrated jointly by UNICEF and the Ministry of Education of Liberia. These data are based on observed data reported by countries and territories. The survey package typically consists of the literacy questionnaire and supporting documentation. Whereas National figure include data from administrative records • Counts of the literacy status is done for the population 10 years of age and older . • The literacy definition may vary from one country to another. Educational attainment or other data are not always used as a proxy for literacy
-Discrepancies • Literacy rates published by the UNESCO Institute of Statistics (UIS) are based on national population censuses and household surveys. Discrepancies may arise since countries derive projected figures using methods that differ from those used by the UIS. - Example, Liberia (10 yrs & above) : UIS ( 15 – 24 yrs) (2) The Youth Literacy Rate reflects the outcomes of primary education over the previous 10 years or so. Reasons for failing to achieve the literacy standard may include low quality of schooling, difficulties in attending school or dropping out before reaching grade 5. Literacy is measured crudely by assuming that people with no schooling are illiterate. This causes difficulty for international comparisons.
INDICATOR #3.Population using improved sanitation facilities (National Definition) A household using an improve sanitation facility is the percentage of the population with access to facilities use by only members of one household (i.e., it is not shared) and the facility use by the household separates the waste from human contact. (International Definition) The proportion of the population using an improved sanitation facility, total, urban, rural, is the percentage of the population with access to facilities that hygienically separate human excreta from human contact.
(National Methodology) The indicator is computed as Numbers of Households using improved Sanitation, to the total population, expressed as a percentage. The same method applies to the rural and urban estimates. (International indicator)Methodology The indicator is computed as the ratio of the number of people using improved sanitation facilities, to the total population, expressed as a percentage. The same method applies to the rural and urban estimates. (National Data source-comments and limitations) LDHS, and Administrative reported data from MOHSW (International Data Source comments and limitations) Primary data sources used including Multiple Indicator Cluster Surveys (MICS), Demographic Health Surveys (DHS), World Health Surveys (WHS), Core Welfare Indicator Questionnaires (CWIQ), and population censuses.
-Differences The international agency (Joint Monitoring Programme, JMP) always uses model based estimates and projections while countries reports only on latest findings of census or household surveys. -Discrepancies The origins of the most common discrepancies between global and national figures are: Use of different definitions of what constitutes access to sanitation. Use of different total population estimates and different estimates for the distribution of the population among urban and rural areas. Routinely reported data from line Ministries, also known as administratively reported data often only record cumulative totals of facilities constructed based on records from government-supported programs. Administrative data often do not take into account facilities constructed under NGO supported programs or facilities constructed by individual households without outside support. For these reasons administrative data are not used at international level for tracking progress towards the MDG drinking water and sanitation target.
INDICATOR #4. Total net enrolment ratio in primary education (National Definition) The primary school net enrolment rate (NER) is the percentage of the primary school age (6-12 years) population that is enrolled in primary school. The official primary school going age is between 6-12 years. Sometimes, there are persons who were in school beyond the recommended primary school age, or not attending at the right age. (International Definition) Net primary enrolment rate in primary education is the number of children of official primary school age (according to ISCED97) who are enrolled in primary education as a percentage of the total children of the official school age population. Total net primary enrolment rate also includes children of primary school age enrolled in secondary education.
(National Methodology/computation) The analysis takes into consideration the differentials in the school attendance status, enrolment, education attainment. It is organized into two broad categories of measures – educational input and educational output. Measures of educational input include school attendance and actual enrolment in school in any grade level of school. (International Methodology/computation) To calculate the indicator one must first determine the population of official school age by reference to the theoretical starting age and duration of ISCED97 Level 1 (primary education) as reported by the country. Then, the number of pupils enrolled in primary (or secondary) education who are of the official primary school age is divided by the population for the same age-group and the result is multiplied by 100.
(International Data Source comments and limitations) Total NERs below 100 percent provide a measure of the proportion of primary school age children who are out of school. -Differences Total NER includes children of primary school age who are enrolled in secondary school. UNESCO using UNPD population estimates may also have contributed to the difference. -Discrepancies Nationally-published figures may differ from the international ones because of differences between national education systems and ISCED97; or differences in coverage (i.e. the extent to which different types of education – e.g. private or special education – or different types of programmes e.g. adult education or early childhood care and education - are included in one rather than the other) and/or between national and the United Nations Population Division (UNPD) population data.
Way Forward • Awareness through workshops, conferences • Consensus with various Statistical Institutions • Engaging institutional heads for standardization • Coordination between International and National Organization