Download
1 / 68
690 likes | 848 Vues
Pertti Nurmi ( Finnish Meteorological Institute ) General Guide to Forecast Verification ( Methodology ) NOMEK - Oslo 15.-16.4.2005. A glimpse to verification history, USA Tornados, 1884 (The Finlay case). 2680 + 30 2800. = 96,8 %. Glimpse to history from the Wild West, cont’d.

E N D
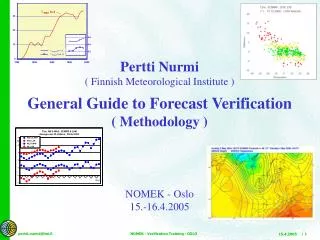
Pertti Nurmi ( Finnish Meteorological Institute ) General Guide to Forecast Verification ( Methodology ) NOMEK - Oslo 15.-16.4.2005 NOMEK - Verification Training - OSLO
A glimpse to verification history, USA Tornados, 1884 (The Finlay case) 2680 + 30 2800 = 96,8 % NOMEK - Verification Training - OSLO
Glimpse to history from the Wild West, cont’d... 96,8 % Never forecast a Tornado 2750 + 0 2800 = 98,2 % NOMEK - Verification Training - OSLO
Another interpretation: Back to the original results: 98,2 % POD = FAR = B = 0 % ! 96,8 % 30 50 = 60 % POD, Probability Of Detection 70 100 = 70 % FAR, False Alarm Ratio 100 50 = 2 B or FBI, (Frequency) Bias NOMEK - Verification Training - OSLO
First reminder on verification: • An act (“art”?) of countless methods and measures • An essential daily real-time practice in the operational forecasting environment • An active feedback and dialogue process is a necessity • A fundamental means to improve weather forecasts and services NOMEK - Verification Training - OSLO
Outline: • Introduction - History • Goals and general guidelines • Continuous variables • Categorical events • Binary (dichotomous; yes/no) forecasts • Multi-category forecasts • Probability forecasts • Forecast value (NOT covered under these lectures) References • Literature • Websites …You heard it already <= Break? Acknowledgement: Laurie Wilson (CMC, Canada) NOMEK - Verification Training - OSLO
Outline: • Introduction - History • Goals and general guidelines NOMEK - Verification Training - OSLO
Goals of *THIS* Training: 2. • Understand the basic properties and relationships among common verification measures • Learn to extract useful information from (graphical) verification results • Increase interest in forecast verification and the methods • Apply them during everyday forecasting practice • Emphasis is on verification of weather elements rather than, e.g. NWP fields NOMEK - Verification Training - OSLO
2 Goals of (objective) Verification: • “Administrative” • Feedback process to operational forecasters => Examplefollows ! • Monitor the quality of forecasts and potential trends in quality • Justify cost of provision of weather services • Justify acquisition of additional or new models, equipment, … • “Scientific” • Identify strengths and weaknesses of a forecast product leading to improvements, i.e. provide information to direct R&D • Value (NOT covered explicitly under these lectures) • Determine the (economic) value of the forecasts to users • Quantitative information on user’s economic sensitivity to weather is needed NOMEK - Verification Training - OSLO
2 Personal scoring (example) ... C C B B A A NOMEK - Verification Training - OSLO
2 Principles of (objective) Verification: • Verification activity has value only if the information generated leads to a decision about the forecast itself or the forecast system being verified • User of the information must be identified • Purpose of the verification must be known in advance • No single verification measure can provide complete information about forecast quality • Forecasts should be formulated in a verifiable form NOMEK - Verification Training - OSLO
2 Operational Verification- “State-of-the-Art” • Comprehensive comparison of forecast(er)s vs. observations • Stratification and aggregation (pooling) of results • Statistics of guidance forecasts (e.g. NWP, MOS) • Instant feedback to forecasters • Statistics of individual forecasters – e.g. Personal biases • Comprehensive set of tailoredverificationmeasures • Simplifiedmeasuresfor laymen • Continuity into history NOMEK - Verification Training - OSLO
2 Allan Murphy’s (rip) “Goodness”: • Consistency: • Forecasts agree with forecaster’s true belief about the future weather [ strictly proper]; cf. Hedging • Quality: • Correspondence between observations and forecasts [ verification ] • Value: • Increase or decrease in economic or other kind of value to someone as a result of using the forecast [ decision theory] NOMEK - Verification Training - OSLO
2 Verification Procedure… • Define predictand types: • Continuous: Forecast is a specific value of the variable • Categorical - Probabilistic: Forecast is the probability of occurrence of ranges of values of the variable (categories) • Temperature; fixed time (e.g. noon), Tmin, Tmax, time-averaged (e.g. 5-day) • Wind speed and direction; fixed time, time-averaged • Precipitation (vs. no precipitation) - POP; with various rainfall thresholds • Precipitation type • Cloud amount • Strong winds (vs. no strong wind); with various wind force thresholds • Night frost (vs. no frost) • Fog (vs. no fog) NOMEK - Verification Training - OSLO
2 Verification Procedure, cont’d… • Define the purpose of verification • Scientific vs. administrative • Define questions to be answered • Distinguish the dataset of matched observation and forecast pairs • Dataset stratification(from “pooled” data) • “External” stratification by time of day, season, forecast lead-time etc. • “Internal” stratification, to separate extreme events for example • According to forecast • According to observation • Maintain sufficient sample size NOMEK - Verification Training - OSLO
Outline: • Introduction - History • Goals and general guidelines • Continuous variables NOMEK - Verification Training - OSLO
3. Continuous Variables: First explore the data • Scatterplots of forecasts vs. observations • Visual relation between forecast and observed distributions • Distinguish outliers in forecast and/or observation datasets • Accurate forecasts have points on a 45 degree diagonal • Additional scatterplots • Observations vs. [ forecast - observation ] difference • Forecasts vs. [ forecast - observation ] difference • Behaviour of forecast errors with respect to observed or forecast distributions - potential clustering or curvature in their relationships • Time-series plot of forecasts vs. observations (or forecast error) • Potential outliers in either forecast or observation datasets • Trends and time-dependent relationships • Neither scatterplots nor time series plots provide any concrete measures of accuracy NOMEK - Verification Training - OSLO
3 Continuous Variables - Example 1; Exploring the data Scatterplot of one year of ECMWF three-day T2m forecasts (left) and forecast errors (right) versus observations at a single location. Red, yellow and green dots separate the errors in three categories. NOMEK - Verification Training - OSLO
3 Continuous Variables • Mean Error aka Bias • ME = ( 1/n ) Σ ( f i – o i ) • Average error in a given set of forecasts • Simple and informative score on the behaviour of a given weather element • With ME > 0 ( < 0 ), the system exhibits over- (under-) forecasting • Not an accuracy measure; Does not provide information of magnitude of errors • Should be viewed in comparison to climatology • Mean Absolute Error • MAE = ( 1/n ) Σ | f i – o i| • Average magnitude of errors in a given set of forecasts • Linear measure of accuracy • Does not distinguish between positive and negative forecast errors • Negatively oriented, i.e. smaller is better • Illustrative => recommended to view ME and MAE simultaneously => Examples follow ! Range: - oo to oo Perfect score = 0 Range: 0 to oo Perfect score = 0 NOMEK - Verification Training - OSLO
3 Continuous Variables • Mean Squared Error • MSE = ( 1/n ) Σ ( f i – o i )2 • or its square root, RMSE, which has the same unit as the forecast parameter • Negatively oriented, i.e. smaller is better • A quadratic scoring rule; Very sensitive to large forecast errors !!! • Harmful in the presence of potential outliers in the dataset • Care must be taken with limited datasets • Fear for high penalties easily leads to conservative forecasting • RMSE is always >/= MAE • Comparison of MAE and RMSE indicates the error variance • MSE - RMSE decomposition is not dealt with here: • Acknowledge Anders Persson (yesterday) Range: 0 to oo Perfect score = 0 NOMEK - Verification Training - OSLO
3 Continuous Variables - Example 1, cont’d… Scatterplot of one year of ECMWF three-day T2m forecasts (left) and forecast errors (right) versus observations at a single location. Red, yellow and green dots separate the errors in three categories. Some basic statistics like ME, MAE and MSE are also shown. The plots reveal the dependence of model behaviour with respect to temperature range, i.e. over- (under‑) forecasting in the cold (warm) tails of the distribution. NOMEK - Verification Training - OSLO
3 Continuous Variables – Example 2 Temperature bias and MAE comparison between ECMWF and a Limited Area Model (LAM) (left), and an experimental post-processing scheme (PPP) (right), aggregated over 30 stations and one winter season. In spite of the ECMWF warm bias and diurnal cycle, it has a slightly lower MAE level than the LAM (left). The applied experimental “perfect prog” scheme does not manage to dispose of the model bias and exhibits larger absolute errors than the originating model – this example clearly demonstrates the importance of thorough verification prior to implementing a potential post-processing scheme into operational use. NOMEK - Verification Training - OSLO
3 Continuous Variables: Aggregation (pooling) vs. Stratification • MOS vs. EP MAE • Aggregate of: • 6 months; Jan – June • 3 lead times; +12, +24, +48 hr • 4 stations in Finland NOMEK - Verification Training - OSLO
3 Continuous Variables: Aggregation (pooling) vs. Stratification Stratifiedby lead time Stratified by month Stratified by station Stratified by month NOMEK - Verification Training - OSLO
3 Continuous Variables: Aggregation (pooling) vs. Stratification • MOS vs. EP Bias • Aggregate of: • 6 months; Jan – June • 3 lead times; +12, +24, +48 hr • 4 stations in Finland NOMEK - Verification Training - OSLO
3 Continuous Variables: Aggregation (pooling) vs. Stratification Stratified by month Stratifiedby lead time Stratified by station Stratified by station NOMEK - Verification Training - OSLO
3 Continuous Variables • General Skill Score • SS = ( A – A ref ) / ( A perf – A ref ) • where A = the applied measure of accuracy, • subscript ”ref” refers to some reference forecast, ”perf” to a perfect forecast • For negatively oriented accuracy measures like MAE or MSE : • SS = [ 1 - A / A ref ] * 100 • i.e. Relative accuracy of the % improvement over a reference system • Reference is typically climatology or persistence; => Apply both; Examples follow ! • If negative, the reference (climate or persistence) is better • MAE_SS = [ 1 - MAE / MAE ref ] * 100 • MSE_SS = [ 1 - MSE / MSE ref ] * 100 • Latter also known as Reduction of Variance, RV • SS can be unstable for small sample sizes, especially with MSE_SS Range: - oo to 100 Perfect score = 100 NOMEK - Verification Training - OSLO
3 Continuous Variables – Example 3 Mean Absolute Errors of End Product and DMO temperature forecasts (left), and Skill of the End Products over model output (right). The better of either ECMWF or local LAM is chosen up to the +48 hour forecast range (hindcast), thereafter ECMWF is used. The figure is an example of both aggregation (3 stations, several forecast ranges, two models, time-average) and stratification (seasons). NOMEK - Verification Training - OSLO
3 Continuous Variables • Linear Error in Probability Space • LEPS = ( 1/n ) Σ | CDFo (f i) – CDFo (o i) | • where CDFois the Cumulative probability Density Function of the observations, determined from a relevant climatology • Corresponds to MAE transformed into probability space from measurement space • Does not depend on the scale of the variable • Takes into account the variability of the weather element • Can be used to evaluate forecasts at different locations • Computation requires definition of cumulative climatological distributions at each location • Encourages forecasting in extreme tails of the climate distributions • Penalizes less than for similar sized errors in a more probable region of the distribution • i.e. opposite to MSE; =>Examples will follow ! • Skill Score • LEPS_SS = [ 1 - LEPS / LEPS ref ] * 100 Range: 0 to 1 Perfect score = 0 Range: - oo to 100 Perfect score = 100 NOMEK - Verification Training - OSLO
0,05 0,2 LEPS for a hypothetical distribution and location: The climatological frequency distribution (left) is transformed to a cumulative probability density distribution (right). A 2 ”unit” forecast error around the median, 13 vs. 15 “units” (red arrows), would yield a LEPS value of c. 0.2 in the probability space ( | 0.5 – 0.3 |, red arrows). An equal error in the measurement space close to the tail of the distribution, 21 vs. 23 ”units” (blue arrows), would result a LEPS value of c. 0.05 ( | 0.95 – 0.9 |, blue arrows) => Fc errors of rare events are much less penalized using LEPS ! NOMEK - Verification Training - OSLO
3 Continuous Variables Skill comparison (example A) ... NOMEK - Verification Training - OSLO
3 Continuous Variables Skill comparison (example B) ... NOMEK - Verification Training - OSLO
3 Continuous Variables Skill comparison (example C) ... NOMEK - Verification Training - OSLO
3 • Continuous variables - Summary: • Verify a comprehensive set of local weather elements • Produce scatterplots & time-series plots, including forecasts and/or observations against their difference • ”Stratify & Aggregate” +Compute ME, MAE, MAE_SS • Additionally, compute LEPS,LEPS_SS, MSE, MSE_SS • Examples 1 - 4 in the General Guide to Verification (NOMEK Training) Examples: • Temperature: fixed time (e.g. noon, midnight), Tmin, Tmax, time-averaged (e.g. 5-day) • Wind speed and direction: fixed time, time-averaged • Accumulated precipitation: time-integrated (e.g. 6, 12, 24 hours) • Cloudiness: fixed time, time-averaged; However, typically categorized NOMEK - Verification Training - OSLO
Outline: • Introduction - History • Goals and general guidelines • Continuous variables • Categorical events • Binary (dichotomous; yes/no) forecasts • Multi-category forecasts NOMEK - Verification Training - OSLO
4. Categorical Events NOMEK - Verification Training - OSLO
4 Categorical Events • Bias aka Frequency Bias Index • B = FBI = ( a + b ) / ( a + c ) [ ~ Fc Yes / Obs Yes ] • With B > 1 , the system exhibits over-forecasting. • With B < 1 , the system exhibits under-forecasting. • Proportion Correct • PC = ( a + d ) / n [ ~ ( Hits + Correct rejections ) / Sum total ] • Most simple and intuitive performance measure. • Usually very misleading because rewards correct “Yes” and “No” forecasts equally. • Can be maximized by forecasting the most common category all the time. • Strongly influenced by the more common category. • Never for extreme event verification !!! B = 2.00 PC = 0.97 Range: 0 to oo Perfect score = 1 Range: 0 to 1 Perfect score = 1 NOMEK - Verification Training - OSLO
4 Categorical Events • Probability Of Detection, Hit Rate ( H ), Prefigurance • POD = a / ( a + c ) [ ~ Hits / Obs Yes ] • Sensitive to misses only, not false alarms. • Can be artificially improved by over-forecasting (rare events). • Complement score Miss Rate, MR = 1 – H = c / (a+c) • Must be examined together with … • False Alarm Ratio • FAR = b / ( a + b ) [ ~ False alarms / Fc Yes ] • Sensitive to false alarms only, not misses. • Can be artificially improved by under-forecasting (rare events). • Increase of POD can be achieved by increasing FAR, and vice versa. B = 2.00 PC = 0.97 POD = 0.60 FAR = 0.70 Range: 0 to 1 Perfect score = 1 Range: 0 to 1 Perfect score = 0 NOMEK - Verification Training - OSLO
4 Categorical Events • Post agreement • PAG = a / ( a + b ) [ ~ Hits / Fc Yes ] • Complement of FAR (i.e. = 1 – FAR). • Sensitive to false alarms, not misses. • False Alarm Rate, Probability of False Detection ( POFD ) • F = b / ( b + d ) [ ~ False alarms / Obs No ] • False alarms, given the event did not occur (Obs No). • Sensitive to false alarms only, not misses. • Can be artificially improved by under-forecasting (rare events) – ref. Tornado case. • Generally used with POD (or H) to produce the ROC score for probability forecasts; • Otherwise rarely used. B = 2.00 PC = 0.97 POD = 0.60 FAR = 0.70 PAG = 0.30 F = 0.03 Range: 0 to 1 Perfect score = 1 Range: 0 to 1 Perfect score = 0 NOMEK - Verification Training - OSLO
4 Categorical Events • Hanssen & Kuiper’s Skill Score, True Skill Statistics • KSS = TSS = POD – F • = ( ad – bc ) / [ (a+c) (b+d) ] • Popular combination skill score of POD and F. • Measures ability to separate “yes” cases (POD) from “no” cases (F). • For rare events, d cell is high => F small => KSS close to POD. • Threat Score, Critical Success Index • TS = CSI = a / ( a + b + c ) • Simple popular measure of rare events. Sensitive to hits, false alarms and misses. • Measure of forecast after removing correct (simple) “no” forecasts from consideration. • Sensitive to climatological frequency of event. • More balanced than POD or FAR. B = 2.00 PC = 0.97 POD = 0.60 FAR = 0.70 PAG = 0.30 F = 0.03 KSS = 0.57 TS = 0.25 Range: -1 to 1 Perfect score = 1 No skill level = 0 Range: 0 to 1 Perfect score = 1 No skill level = 0 NOMEK - Verification Training - OSLO
4 Categorical Events • Equitable Threat Score • ETS = ( a – a r ) / ( a + b + c – a r ) • where a r = ( a + b ) ( a + c ) / n • … is the number of hits due to random forecasts. • Simple TS may include hits due to random chance. • Heidke Skill Score • HSS = 2 ( ad – bc ) / [ ( a + c )( c + d ) + ( a + b )( b + d ) ] • One of the most popular skill measures for categorical forecasts. • Score against random chance. B = 2.00 PC = 0.97 POD = 0.60 FAR = 0.70 PAG = 0.30 F = 0.03 KSS = 0.57 TS = 0.25 ETS = 0.24 HSS = 0.39 Range: -1/3 to 1 Perfect score = 1 No skill level = 0 Range: - oo to 1 Perfect score = 1 No skill level = 0 NOMEK - Verification Training - OSLO
4 Categorical Events • Odds ratio • OR = a d / b c • Measures forecast system’s probability (odds) • to score a hit (H) as compared to making a false alarm (F): • OR = [ H / ( 1 – H ) ] / [ F / ( 1 – F ) ] • Independent of potential biases between observations and forecasts. • Transformation into a skill score, ranging from -1 to +1: • ORSS = ( ad – bc) / ( ad + bc ) • = ( OR – 1 ) / ( OR + 1 ) • Produces typically very high absolute skill values, due to definition. • Practically never used in meteorological forecast verification. Range: 0 to oo Perfect score = oo No skill level = 1 B = 2.00 PC = 0.97 POD = 0.60 FAR = 0.70 PAG = 0.30 F = 0.03 KSS = 0.57 TS = 0.25 ETS = 0.24 HSS = 0.39 OR = 57.43 ORSS = 0.97 NOMEK - Verification Training - OSLO
4 Categorical Events – Example 5 Precipitation in Finland Contingency table of one year (with 19 missing cases) of categorical rain vs. no rain forecasts (left), and resulting statistics (right). Rainfall is a relatively rare event at this particular location, occurring in only c. 20 % (74/346) of the cases. Due to this, PC is quite high at 0.81. The relatively high rain detection rate (0.70) is “balanced” by high number of false alarms (0.46), with almost every other rain forecast having been superfluous. This is also seen as biased over-forecasting of the event (B=1.31). Due to the scarcity of the event the false alarm rate is quite low (0.17) – if used alone this measure would give a very misleading picture of forecast quality. The Odds Ratio shows that it was 12 times more probable to make a correct (rain or no rain) forecast than an incorrect one. The resulting skill score (0.85) is much higher than the other skill scores which is to be noted - this is a typical feature of the ORSS due to its definition. NOMEK - Verification Training - OSLO
4 Multi-category Events • Extension of 2*2 to several (k) mutually exhaustive categories • Rain type: rain / snow / freezing rain (k=3) • Wind warnings: strong gale / gale / no gale (k=3) • Only PC (Proportion Correct) can be directly generalized • Other verification measures need be converted into a series of 2*2 tables • “Forecast event” distinct from the “non-forecast event” Generalization of KSS and HSS – measures of improvement over random forecasts: KSS = { Σ p ( fi , oi ) - Σ p ( fi ) p ( oi ) } / { 1 - Σ ( p (fi) ) 2 } HSS = { Σ p ( fi , oi ) - Σ p ( fi ) p ( oi ) } / { 1 - Σ p ( fi ) p ( oi )} NOMEK - Verification Training - OSLO
4 Multi-category Events – Example 6 Cloudiness in Finland Multi-category contingency table of one year (with 19 missing cases) of cloudiness forecasts (left), and resulting statistics (right). Results are shown exclusively for forecasts of each cloud category, together with the overall PC, KSS and HSS scores. The most marked feature is the very strong over-forecasting of the “partly cloudy” category leading to numerous false alarms (B=2.5, FAR=0.8), and, despite this, the poor detection (POD=0.46). The forecasts cannot reflect the observed U‑shaped distribution of cloudiness at all. Regardless of this inferiority both overall skill scores are relatively high (c. 0.4), following the fact that most of the cases (90 %) fall either in the “no cloud” or “cloudy” category - neither of these scores takes into account the relative sample probabilities, but weight all correct forecasts similarly. NOMEK - Verification Training - OSLO
4 Multi-category Events – Example 6, cont’d… 197 156 112 96 94 37 The previous data transformed into hit/miss bar charts, either given the observations (left), or given the forecasts (right). The green, yellow and red bars denote correct and one and two category errors, respectively. The U-shape in observations is clearly visible (left), whereas there is no hint of such in the forecast distribution (right). NOMEK - Verification Training - OSLO
4 Multi-category Events Example from Finland, Again ! 106 33 NOMEK - Verification Training - OSLO
4 • Categorical(binary, multi-category)events - Summary: • Verify a comprehensive set of categorical local weather events • Compile relevant contingency tables • Include multi-category events • Focus on adverse and/or extreme local weather • “Stratify & Aggregate” + Compute B, (PC),POD & FAR, (F), (PAG),KSS, TS, ETS, HSS • Additionally, compute OR, ORSS, ROC • Examples 5 - 6 in the General Guide to Verification (NOMEK Training) Examples • Rain (vs. no rain); with various rainfall thresholds • Snowfall; with various thresholds • Strong winds (vs. no strong wind); with various wind force thresholds • Night frost (vs. no frost) • Fog (vs. no fog) NOMEK - Verification Training - OSLO
Outline: • Introduction - History • Goals and general guidelines • Continuous variables • Categorical events • Binary (dichotomous; yes/no) forecasts • Multi-category forecasts • Probability forecasts NOMEK - Verification Training - OSLO
5 Why Probability Forecasts ? ( A sophisticated, indirect phrase to emphasize the importance of addressing uncertainty… ) • “… the widespread practice of ignoring uncertainty when formulating and communicating forecasts represents an extreme form of inconsistency and generally results in the largest possible reductions in quality and value.” - Allan Murphy (1993) NOMEK - Verification Training - OSLO