Download
1 / 40
410 likes | 568 Vues
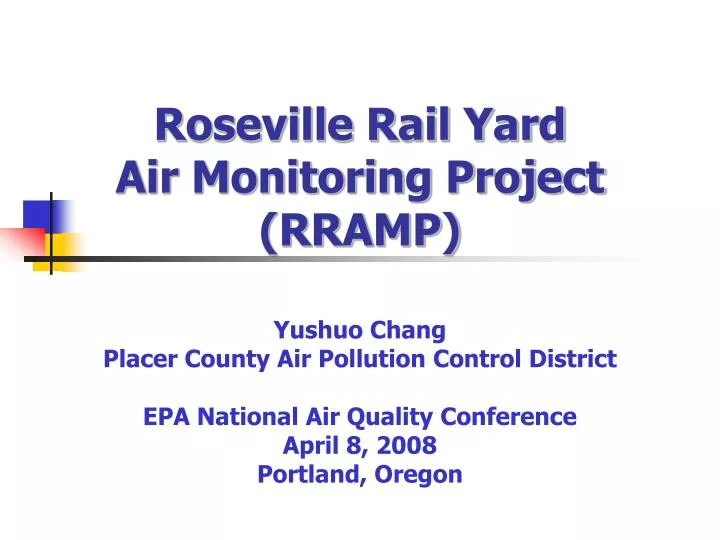
Roseville Rail Yard Air Monitoring Project (RRAMP). Yushuo Chang Placer County Air Pollution Control District EPA National Air Quality Conference April 8, 2008 Portland, Oregon. To Sacramento westbound trains. Sac-Placer County Line. Main Departure Yard. Rock pile Yard. North side

E N D
Roseville Rail YardAir Monitoring Project (RRAMP) Yushuo Chang Placer County Air Pollution Control District EPA National Air Quality Conference April 8, 2008 Portland, Oregon
To Sacramento westbound trains Sac-Placer County Line Main Departure Yard Rock pile Yard North side Tracks (through trains) Hump-Trim Main Receiving Yard Service Area: Staging Tracks Wash Racks Service Tracks Mod/Search Bldg. Maintenance. Shop Ready Tracks Subway City Yard Downtown Roseville Northbound Tracks Eastbound Tracks
Overview • Background • Project Design • Data Analysis • Next Step
Facts about theRoseville Rail Yard • Located near City of Roseville • occupies about 950 acres, 2/3 in Placer County and 1/3 in Sacramento County • Maintenance, service and classification yard (24/7 operation) • the largest rail facility on the West Coast • About 31,000 locomotives stopped at the Yard in 2000 • Plus additional 15,000 non-stop locos through the yard • 2,350,000 gallons of fuel dispensed monthly
ARB Rail Yard Study • In 2000, Placer County APCD (PCAPCD) asked California Air Resources Board (CARB) to conduct a risk assessment of Rail Yard in response to community concerns. • ARB agreed, conducted the study, and released results in October 2004.
Key Findings in ARB Study • Diesel PM emissions estimated to be about 25 tons in 2000 • Large region impacted by the diesel PM emissions from the Yard • excess cancer risk of 100-500/million affect an area in which 14,000-26,000 people live • excess cancer risk of 10-100/million affect an area in which 140,000-155,000 people live
Agreement Between UP and PCAPCD • Mitigation Plan • UP committed to reduce diesel PM emissions from 2000 baseline level by 25% by the end of 2007 • Monitoring Project (RRAMP) • UP to provide at least $100,000 to monitor diesel PM emissions from the rail yard • Grant Program • UP committed to provide at least $150,000 to reduce one ton of diesel PM from other sources in Roseville area
RRAMP Objectives • Determine, through monitoring, localized air pollutant concentrations from the UPRR facility • Verify if possible effectiveness of mitigation measures over time • Provide feedback to the community • Provide information for further modeling analysis
Project Participants • Placer County APCD (project coordinator) • UPRR (funding, logistics) • Sacramento AQMD (funding, resources) • South Coast AQMD (laboratory analysis) • USEPA Region 9 (funding, resources) • CARB (audits, resources) • Technical Advisory Committee (TAC)
Monitoring Strategy • Utilize two pairs of upwind/downwind site locations • Minimize non-UPRR emissions sources between each pair • Optimize pair orientation to the prevailing wind direction • Optimize time of year with predominance of prevailing wind: summer months
Monitoring Strategy (cont’d) • One pair located to cover area with model-predicted maximum impact • Second pair located where logistics can find optimum directional (prevailing wind) alignment
Diurnal Considerations • Time of day of most persistent winds • night time • Emissions from Rail Yard during time of most persistent winds • Constant emissions from yard activities
Roseville plot showing the persistent wind direction in summer
Instrumentation Approach • Utilize continuous monitors to capture short-term details: • Aethalometers (for black carbon) • BAMs (for PM2.5) • NO/NOx Analyzers • Wind
Instrumentation Approach (cont’d) • Use filter based FRMs to compare continuous measurements to reference methods for PM • Teflon filter for PM2.5 mass • Quartz filter for EC/TC • Establish model grade met tower on UPRR facilities • Erect on-site wind data
Aerial View of Sites Prevailing wind direction
Project Duration • 3 Years (2005-2007) • Denio / Pool sites: • 2005: 7/15~10/15 • 2006 & 2007: 6/15~10/15 • Church St. / Vernon St. sites: • 2005: 9/7~10/15 • 2006 & 2007: 6/15~10/15
On-site Met Tower in consistent with Roseville in CARB Study June ~ September 2200 ~ 0500
Screening Criteria • Wind Direction • Between 45o and 225o to capture max impacts from emissions • Wind Speed • Between 1 and 4 m/s to avoid calm or windy conditions • Time Frame • Overnight hours from 10PM to 5AM during period of steady winds and emissions
Summary • Higher average concentrations at downwind sites relative to upwind site is highly significant. • Little or no significant difference in concentrations between upwind sites • Ratios of NO/NOx and BC/PM2.5 are indicative of fresh emissions at downwind sites only
2007 Report • Analysis is in progress • Draft report will be submitted to PCAPCD governing Board in June, 2008 • 3-year trend analysis • Re-analyzing 2005 data to reconcile with 2006 & 2007 data analysis procedures • 2005 ~ 2007
Additional Monitoring • Rationales: potential emission reduction • Low sulfur diesel usage • Idling management practice • Switcher replacement/upgrades • Monitoring period • Same as 2006 & 2007 • 2008 data report • Including 4 year (2005 ~ 2008) trend analysis
Contact Information Yushuo Chang Planning & Monitoring Supervisor ychang@placer.ca.gov (530)745-2325 Placer County APCD website http://www.placer.ca.gov/Departments/Air/railroad.aspx