Debugger
Debugger. Dbx and Xdbx. Dbx debugger. Debugger ใช้เป็นสภาพแวดล้อมของการโปรแกรม เพื่อสนับสนุนการตรวจจับความผิดพลาดของโปรแกรม ภายใต้การควบคุมของโปรแกรมเมอร์ หรือการตรวจสอบ core dump โดยระบบ โดย debugger จะช่วยให้โปรแกรม ปราศจาก bug ได้. DBX. Dbx เป็น debugger ที่นิยมใช้กันมากบน BSD

Debugger
E N D
Presentation Transcript
Debugger Dbx and Xdbx
Dbx debugger Debugger ใช้เป็นสภาพแวดล้อมของการโปรแกรม เพื่อสนับสนุนการตรวจจับความผิดพลาดของโปรแกรม ภายใต้การควบคุมของโปรแกรมเมอร์ หรือการตรวจสอบ core dump โดยระบบ โดย debugger จะช่วยให้โปรแกรม ปราศจาก bug ได้
DBX • Dbx เป็น debugger ที่นิยมใช้กันมากบน BSD • โดยมันจะเป็นคำสั่งระดับสูงและมีลักษณะการใช้งาน • ง่ายเมื่อเทียบกับ adb การทำงานจะเป็นในลักษณะ • interactive • line-oriented • source-level • symbolic debugger
DBX Dbx จะช่วยให้เราตรวจสอบได้ว่าเมื่อโปรแกรม crashed ค่าตัวแปร และ expression เป็นอย่างไร เรา สามารถจะ set breakpoint ใน code และ run trace โปรแกรมได้
การ compile program ก่อนการใช้ dbx ก่อนที่เราจะ run dbx นั้นเราต้องทำการ compile โปรแกรมโดยใช้ cc option -g ซึ่ง option นี้จะเก็บ symbol table และข้อมูลสำหรับการ debugging ที่จะใช้ สำหรับ debugger จากนั้นให้ทำการ run โปรแกรม แล้ว เมื่อเกิด core dump ให้ run dbx
dbx จะประกอบด้วย 2 argument • ชื่อของ object file ซึ่งมี defult เป็น a.out ถ้าไม่ได้ระบุเป็นชื่ออื่น • ชื่อของ core file การรัน dbx จะปรากฏ promt ดังนี้ $ dbx ....... (dbx)
ตัวอย่างคำสั่งที่นิยมใช้ตัวอย่างคำสั่งที่นิยมใช้ where เป็นคำสั่งที่ใช้หาจุดที่ผิดพลาดใน โปรแกรมโดย จะแสดงพื้นที่ใน memory และบอก บรรทัดทีมี function ที่เกิดข้อผิดพลาดให้เราทราบ (dbx) [1] number (0xef793a1c , 0x7ffffffc,0xefffffd54...... [2] __doscan_u(0xef793a1c,0x108f2,0x64,0x31.... [3] scanf(0x108f0,0x0,0xef79cfc...... => main (), line5 in “ex1.c”
trace คำสั่งนี้ใช้ในการติดตามดูค่าของตัวแปร ขณะที่ทำการ execute โดยจะมีการใช้ trace ในหลายลักษณะดังนี้ line tracing : trace #trace each source line trace in<proc> #trace each source line while in proc trace [at] <#line> #trace given source line
trace call tracing : trace <proc> #trace cals to the peocedure trace inmember<func> #trace call to any member function name trace infunction<func> #trace when function name is called trace in class #trace calls to any member function of class
trace value tracing : trace <exp> at <line#> # print <exp> when <line> is reached trace<var>[in<proc>] # trace changes to the variable
run เป็นคำสั่งที่ใช้เริ่มการ execute โปรแกรม โดยใช้ argument ปัจจุบัน run<args> เริ่มการ execute โปรแกรม โดยกำหนด argument ขึ้น มาใหม่ ตัวอย่างเช่น (dbx) run 21, 1
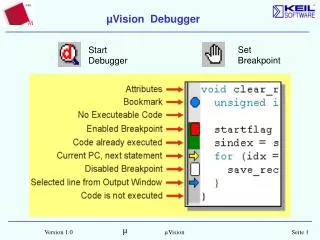
Stop at<line> เป็นคำสั่งที่หยุดการ execute ไว้ ณ บรรทัดที่เราระบุซึ่ง operation นี้เราเรียกว่าการ set breakpoint stop at <line> #stop execute at the line (dbx) stop at 49 [1] stop at “foo.f”:49 (dbx)
stop in<proc> คำสั่งนี้จะหยุดการ execute เมื่อถึง procedure ที่เราระบุ นี่ก็เป็นการ set breakpoint อีกอันหนึ่ง ตัวอย่าง (dbx) stop in foobar [2] stop in foobar (dbx)
list list <line>, <line> -list source lines คำสั่งนี้ใช้เพื่อพิมพ์ source code โดย argument line นั้นเป็นจำนวนบรรทัดที่ต้องการพิมพ์ เช่น (dbx) list 3 1 #include<stdio.h> 2 main(argc,argv) 3 int arc;
Print print <exp> - print the value of the expression ใช้เพื่อแสดงค่าของตัวแปร (dbx) stop at 19 (dbx) run 20 (dbxX print var1 1000
print (dbx) print tol, regfal 9.9999997473787516e-05 .false. (dbx) เมื่อ tol เป็นชื่อของตัวแปรชนิด double และ regfal เป็นชื่อของตัวแปร boolean และเมื่อเราต้องการให้แสดงค่าของตัวแปร array เช่น ตัวแปร y มี 2 element (dbx) print y (1) 5.0 (2) 1.0
print print expression (dbx) print y(i+1) + 2 3.0 (dbx)
Step เป็นคำสั่งเพื่อ excute statement ถัดไปโดย จะทำการ execute ทีละ step
status status - print trace/stop's in effect คำสั่งนี้ใช้ร้องถาม debugger เพื่อแสดงรายการคำสั่งที่มันจำได้ไว้ เช่นเมื่อเราใช้ คำสั่ง stop ทั้ง 2 ดังตัวอย่างที่ผ่านมามันก็จะแสดงคำสั่ง (dbx) status [1] stop at "foo.f":49 [2] stop in foobar.foobar (dbx)
delete คำสั่ง delete delete <number> - remove trace or stop of given number คำสั่ง delete ใช้เพื่อลบลำดับคำสั่งที่ debugger เก็บไว้ใน list เช่น (dbx) delete 1 (dbx) status [2] stop in foobar.foobar (dbx)
next เป็นคำสั่งเพื่อ execute ทีละ step ครั้งละ 1 บรรทัด next #step one line (step OVER calls) next<n> #step <n> lines (skip OVER calls)
cont คำสั่ง cont cont - continue execution
return คำสั่ง return return - continue subprogram but stop upon return ใช้คำสั่งนี้เมื่อขณะที่เรากำลัง execute คำสั่ง ทีละ step ใน subprogram และหยุดไว้เพื่อเข้ามาทำงานที่ตัวที่เรียกใช้ subprogram นั้น
quit คำสั่ง quit quit เป็นคำสั่งที่ใช้เพื่อออกจากการทำงานของ dbx เช่น Exit dbx.
xdbx debugger debugger แบบ interactive ที่ทำงานบน window-based ซึ่งมันได้เตรียมความสะดวกในการรันโปรแกรม และยังใช้ง่ายกว่า dbx เนื่องจากสามารถใช้ mouse และมี graphical user interface นอกจากนี้มันยังคงใช้ dbx ที่เป็น commandแบบเดิมได้
How debugger work เช่นเดียวกับ dbx ที่ debugger ต้องอาศัย informationที่ ใช้ในการ debugging จากการ compile โดยใช้ option -g จากนั้นก็ run โปรแกรม แล้วทำการเรียก debugger ขึ้น มา จากนั้นก็ทำการ load file a.out ขึ้นมาทำการ debugging ได้
การเปิด dbx มาใช้งาน • ทำการพิมพ์ว่า debugger ที่ command shell • prompt • หรือ double click ที่ debugger icon ใน SPARC works/ProWorks Manager
คุณลักษณะของ debugger • มีการ setbreakpoint ที่บรรทัด หรือว่าใน function ได้ สามารถ trace โปรแกรมบรรทัดต่อบรรทัดโดยอาจจะ execute แบบทั้งหมดของโปรแกรมหรือว่าจะเฉพาะภายใน function ก็ได้ • สามารถ set multiple breakpoint หรือ tracepoint ใน C++ ในทุก function ที่มี class เดียวกันหรือว่าข้าม class
run , stop , continue execute (ที่บรรทัดถัดไปหรือว่าข้ามไปบรรทัดอื่นก็ได้ ) และยังสามารถ save และ replay ทั้งหมดหรือว่าเฉพาะส่วนของการรัน debugger ได้ • มี Use Run Time Checking (RTC ) เพื่อตรวจจับ run time error อย่างอัตโนมัติ RCT ยังตรวจจับ memory error และ memory leaks ได้ • มี loop up declaration ของการระบุและการอธิบายชนิด class และ templates
ใช้ data inspector ที่เป็นกราฟฟิกเพื่อตรวจจับค่าตัวแปรที่ประกอบด้วย structure ที่มีโครงสร้างที่ซับซ้อน และ array และมี monitor แสดงค่าตัวแปรขณะโปรแกรม execute • สนันสนุน virtual function for C++ • สนับสนุน C++ exceptions • Debug กับ C++ template
ใช้ embeded Korn shell สำหรับการโปรแกรม • ใช้ program input /output Windows เพื่อ เตรียม interface คำสั่ง I/O สำหรับโปรแกรม ซึ่งมันจะไม่เข้าไปยุ่งกับ dbx interaction ใน command window
Graphical overview • Menu item • information fields • source display • button commands • command pane • program input / output windows
Menu item Menu button ที่จะอำนวยความสะดวกในการ debugging เนื่องจากใน title bar จะประกอบด้วย คำสั่งต่างๆที่ใช้กันทั่วไปในการ debugging information fields จะเป็นส่วนที่บอกรายละเอียดว่า code ที่แสดงที่ source display คือ file ใด และชื่อ function ที่ใช้ในขณะนั้น
source display เป็นส่วนที่แสดงรายละเอียดของโปรแกรม button commands เป็นปุ่มที่เป็นคำสั่ง dbx ที่ใช้กันบ่อย command pane เป็นส่วน Windows ที่สนับสนุนการใช้ text command สำหรับผู้ที่ถนัดการใช้ dbx command
program input / output windows ใช้ program input /output Windows เพื่อเตรียม interface คำสั่ง I/O สำหรับโปรแกรม ซึ่งมันจะไม่เข้าไปยุ่งกับ dbx interaction ใน command window ใช้รับและแสดง input ของการใช้dbx ในการ debugging program
การเริ่ม debugger จาก command tool • การเริ่ม debugger จาก command tool • เพื่อเริ่ม debugger จาก windowscommand tool (หรือ Shel tool) • ที่ Prompt พิมพ์ • % debugger [-options] [program_name [corefile | process_id] ]
Program Loader เมื่อเริ่มเรียก Debugger จาก manager debugger หน้าต่าง source display ยังว่างเปล่าเนื่องจากยังไม่ได้ load program เข้ามา การใช้ program loader ก็เป็นการเลือกโปรแกรม execute แล้วเพื่อ load เข้าไปภายใน debugger การ load program ทำได้ดังนี้
Program Load Visit.. Make List Module Input /Output • เลือก load จากโปรแกรม menu เพื่อแสดง program loader • . • click ที่ชื่อ filename เพื่อเลือกโปรแกรม แล้ว click ที่ load
The breakpoint menu Breakpoint menu ประกอบด้วย item สำหรับ set ชนิดของ breakpoint Breakpoint Stop At <line> Stop In <func> Stop in Member Stop in Class Stop in Function Stop <variable> Clear clear All List Breakpoints
Stop At <line> - sets breakpoint at select line. stop in <func>-sets breakpoint in selected procedure or function stop in member<func>-sets breakpoint in all member function with same name as selected member function across all classes stop in class<class>-sets breakpoint in all member function of <class> stop in function <func>-sets breakpoint in all top level function with same name (overloaded) as selected top level function stop<variable>-sets breakpoint at a change in the value of the specified<variable> clear<line> -clear breakpoint at select line clear-clear breakpoint at current stop location (regardless of current selection ) clear all breakpoints-clears breakpoint at all location List breakpoint-list all current active breakpoint and trace
การ set breakpoint • Setting a Breakpoint at line of source code • เลือกตัวอักษรตัวใดตัวหนึ่งในบรรทัดแล้วเลือก Stop At <line> จาก breakpoint menu
Setting a Breakpoint in function • เลือกชื่อ Function แล้วเลือก stop In<func> จาก breakpoint menu
Listing and clearing event management commands • การแสดงรายการ breakpoint สามารถทำได้บน menu และ บน command pane เพื่อแสดงรายการ breakpoint ทั้งหมดให้ • เลือก List Breakpoint จาก breakpoint จาก breakpoint menu ซึ่งคำสั่งนี้จะเท่ากับคำสั่ง status
Clearing a breakpoint at a line • เพื่อทำการ clear breakpoint ที่ระบุในแต่ละบรรทัดทำได้ดังนี้ • เลือกบรรทัดใน source display ที่ถูก set breakpoint • เลือก clear <line> จาก breakpoint menu
Delete Specific Breakpoint Using status ID number • Delete Specific Breakpoint Using status ID number • คำสั่ง delete ใช้เพื่อลบลำดับคำสั่งที่ debugger เก็บไว้ใน list ซึ่งทำการ delete โดย • ลบโดยใช้ delete ID_number ใน command pane (debugger ) เช่น • delete 3 5 • ลบทุกเหตุการณ์ที่ถูก load เข้าไปใน debugger โดยใช้ คำสั่ง • delete all
Running a program • Running a program without argument • เพื่อที่จะ run โปรแกรมใน debugger โดยไม่มี argument • เลือกที่ execution จาก menu แล้วเลือก run with argument • Adding argument to the run command • เลือกที่ execution จาก menu แล้วเลือก run with argument หลังจากนั้นใส่ argument ที debugger windows ดังภาพ
Adding argument to the run command เลือกที่ execution จาก menu แล้วเลือก run with argument หลังจากนั้นใส่ argument ที debugger windows ดังภาพ
Reference Ramkrishna S.Tare , UNIX Utilities, McGRAW-HILL International Editor 1988 workshop SPARC work 3.1,Debugging a program ,SunSoft inc , 1995http://www.physics.utah.edu/~p573/hamlet/lessons/dbx/dbx/node19.html