Download
1 / 36
360 likes | 502 Vues
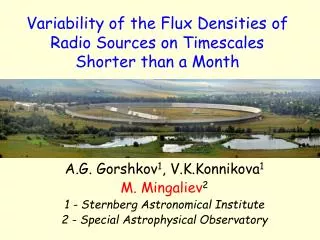
The nature of extragalactic radio sources variability. Gorshkov A., Konnikova V., Mingaliev M.

E N D
The nature of extragalactic radio sources variability Gorshkov A., Konnikova V., Mingaliev M.
After the discovery of variability of extragalactic radio sources it became clear that variations on time scales longer than a year are due to instabilities in the associated active galactic nuclei [I.S. Shklovsky, H. Van der Laan]. Variations on shorter time scales can be either intrinsic [S.J. Qian et al.] or due to scattering in the turbulent interstellar medium [B.J. Rickett et al.]. Currently, the best agreement with the observed characteristics of the long-term variations is achieved for shock models [for instance, Marscher and W. K.Gear.].
Active variability studies are under way at many observatories around the world. Many-year series of observations at decimeter wavelengths have been obtained for large samples of radio sources [M. Bondi et al.]. The longest series of centimeter-wavelength observations have been carried out at the University of Michigan [H. D. Aller et al.]. Since 1997 the RATAN-600 radio telescope has been used to do simultaneous observations of a sample of ~600 sources with VLBI fluxes at 13 cm exceeding 100 mJy [Yu.A. Kovalev et al.].
Compact radio sources have been monitored at millimeter wavelengths for more than 20 years at the Metsähovi Radio Observatory [E. Valtaoja, M. Tornikoski et al.]. We have also been conducting simultaneous observations at 0.97–21.7 GHz with the RATAN for more than 20 years (1984–2006) . Our monitoring differs from the data of Kovalev’s in two aspects. First, we observe samples that are complete to a limiting flux density; second, from 1998 the duration of our continuous daily observations of our samples was 60–100 days. This has enabled us to study variations on time scales of several days along with the longer-term variations.
As a result of more than forty-year studies of variability became clear that the majority of extragalactic radio sources demonstrate variability on time scales from tens years up to tens minutes: • variations on time scales longer than a year (long term variability) are due to instabilities in the associated active galactic nuclei;
variations on scales of month can be either intrinsic or due to the scattering in the turbulent interstellar medium; • variations on daily scales (short term variability) most likely has the external reason. In this report I will talk about all temporary scales of the variability.
Here one can see the selection criteria of our samples: • S 200 mJy at 3.9 GHz (Zelenchuk Survey) • RA = 00h 24h • Declination = +04 06 • |b| > 15 • N = 138 objects • S 200 mJy at 4.85 GHz (MGB Survey) • RA = 00h 24h • Declination = +10 12.5 • |b| > 15 • N = 154 objects
Results in this report about long term variability are mostly from the first sample (Decl = +04 06) The sub-sample of sources with the flat spectra consists of 68 objects. Optical identifications were done for 56 of them (82%): • 41 – QSO; • 5 – Bl Lac; • 5 – Galaxies of different types. For all sources spectra in a range of 0.97-21.7 GHz are measured.
According to their spectra we derived all sources into 4 classes: • single-component sources with no extended component and only one compact component (in most cases these are the GPS or HPS sources, with maxima at the GHz frequencies); • two-component sources with an extended component and a single compact component; • Sources with a dominant extended component and a weak compact component (these are actually also two component sources, but the compact component’s influence is manifest only in the flattening of the spectrum at high frequencies); • sources with complex spectra, which can have an extended component and two or more compact components observed simultaneously.
We divided all obtained in 20 years light curves into 3 types, independent of object’s classifications in the optical domain: Slowly variable sources; Sources with the isolated flares; And sources with the chaotic variability. Practically all single-component sources and sources with the prevailing extended component are the slowly variable objects. The sources, which have 2 and 3 type of variability, as a rule, have two-component or complex spectra.
Relation between the variability indices of individual flares Vf and the variability indices V of the same sources for the whole period of our observations. Vf = −0.018 + 0.86V 0.02 0.05
In its majority the nature of the variability of sources with the flare activity more or less corresponds to model in which variability is the result of the evolution of the shock which is propagating along the jet. According to this model in its development shock passes the stages of amplification, balance (when the energy losses and gains are comparable) and damping. The shape of the shock spectrum corresponds to that for a single source and remains the same in the course of the shock evolution. As the shock develops, the peak frequency moves towards lower frequencies.
These are precisely the sort of spectral variations we observe in most cases. When the peak frequency of a flare is above the studied range the spectrum can be approximated well with a parabola. Sometimes the peak frequency is high enough that the spectrum can be described with a power-law function in our frequency range. As the flare develops the peak frequency moves to lower frequencies finally entering our studied range (1-22 GHz).
The observed maximum variation amplitude normalized so that ΔSmax(νmax) = 1
Now I’ll talk a little bit about QSOs properties of our sample: 41 sources (from 68). 4 have single-component spectra with Zmean = 1.7 ± 0.3); 13 two component spectra (Zmean= 1.6 ± 0.2); 3 spectra with a dominant extended component (Zmean= 2.0 ± 0.4); and 21 complex spectra (Zmean= 1.6 ± 0.2). The deviations of the mean redshifts of the QSOs with different spectral classes from the value for all the quasars in our sample (Zmean= 1.64 ± 0.12) are not statistically significant.
We were able to determine timescales for flares detected in 26 quasars. The apparent linear sizes lie within 0.18–2.3 pc, while their true sizes lie within 0.06–1.0 pc (E. Valtaoja). • The flare Tbvalues exceed the Compton limit in 14 quasars. With one exception the linear sizes of the emitting regions in these objects are within 0.29 pc. • Among objects with smaller angular sizes none has Tbbelow the Compton limit.
The variability indices for the objects with Tb > 1012 K are higher than those for the objects with Tb < 1012 K.
Relations between the variability indices and Z (Tb < 1012 K): But if we do correction to rest frame there is no any dependence
Some conclusions from the long-term variability • For 40 sources it was possible to determine the visible characteristic time of flare which allowed for the objects with known red shifts to determine the visible angular dimensions and Tb ; • In 14 sources Tb > 1012 K. For these sources the average value of the Doppler-factor is 2.0; • In all QSOs with the linear sizes less than 0.29 pc Tb exceeds Compton limit. The reason for so sharp boundary is not clear.
There exists a small number of radio sources when the shape of spectrum remains constant with variations in the flux density. We suppose that for multi-component sources such variability is due to changes in the angle between the jet and the line of sight. In the case of flat-spectrum sources ( 0) we probably observe a single inhomogeneous compact source.
The characteristics of the compact components of QSO’s with brightness temperatures within the Compton limit are independent of redshift. This follows from the lack of Z-dependence for the following parameters: • the linear sizes of the emitting regions; • the both variability indices (V and Vf ); • the peak frequencies of compact components. We suppose that these can be interpreted as evidence for a lack of cosmological evolution of QSOs at least up to Z = 3. (Astronomy Reports, 2008, Vol. 52, No. 4, pp. 278–298)
We already reported earlier about the detection of variations which we named as “weekly”. These variations were discovered in 1998 at the RATAN in 0527+0331. Variations were cyclic with the characteristic time of 12-16 days.
Since 1998 we observed 112 sources with the flat spectra of two different samples. “Weekly” variability is detected in 38 objects. The main properties are: • Variability usually is manifested at two or three frequencies both at low and at high frequencies; • Characteristic times are from 6 to 40 days; • In the same source characteristic time can change with the frequency and in the different epochs of observations; • In the strongest sources the variation is correlated at the adjacent frequencies.
There is correlation with long-term variability: most frequently the “weekly” variability is observed near the maximum of the long-term variability.
The spectrum of variable component corresponds to the spectrum of uniform source.
But in general spectrum of the “weekly” variable component not as simple as in 0527+0331.For example - 0409+1217: BL Lac, Z=1.020
The most likely that the falling spectra of “weekly” variations is the strongest manifestations of scintillations (“flicker”) discovered by Heeschen in 1984 (variations of flux density of the flat spectra radio sources at cm-wavelengths on the scales of several days). The variability index is just several percentages but they are observed practically in all sources with the flat spectra. Variations have average characteristic time ~4 days.
For the definition of temporal scale structure function was used: - temporal lag
In this case we suggest that we observe “flicker” as well as intrinsic variability
0527+0331:observations at 32 m dish of the Zelenchukskaya Observatory of Institute of Applied Astronomy; = 3.5 cm. IDV
1819+3845: observations at 32 m dish of the Zelenchukskaya Observatory of Institute of Applied Astronomy;February 5, 2005; = 3.5 cm.