Download
1 / 56
560 likes | 703 Vues
NEMURO.FISH: A NPZ-Fish Bioenergetics/Population Dynamics Model for Pacific Saury and Herring by Bernard A. Megrey Francisco E. Werner. Process: 10 workshops over 7 years strong international collaboration several funding sources. Acknowledgments. We are grateful to our sources of funding:

E N D
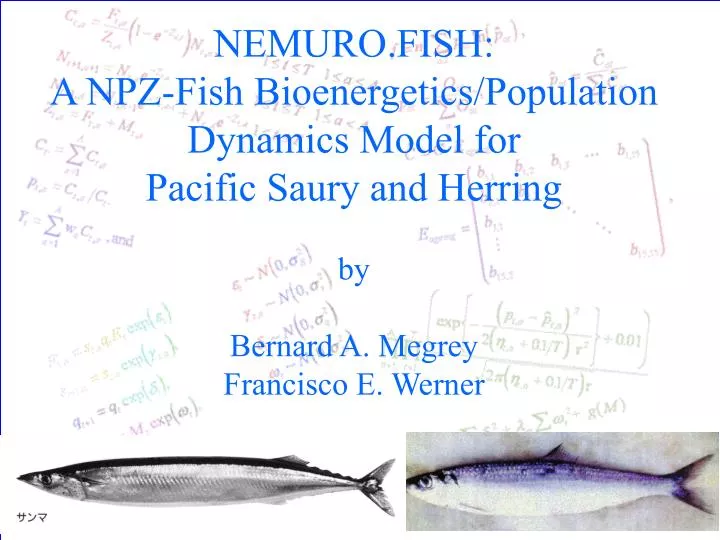
NEMURO.FISH: A NPZ-Fish Bioenergetics/Population Dynamics Model for Pacific Saury and Herring byBernard A. MegreyFrancisco E. Werner
Process:10 workshops over 7 yearsstrong international collaboration several funding sources
Acknowledgments We are grateful to our sources of funding: • North Pacific Marine Science Organization (PICES) • City of Nemuro Japan • Heiwa-Nakajima Foundation • Japan International Science and Technology Exchange Center • Japan Fisheries Research Agency • Asia-Pacific Network • GLOBEC
Primary Collaborators Kenneth Rose, Louisiana State University, USA Rob Klumb, Great Plains Fish and Wildlife Management Assistance Office, USA Douglas Hay, Pacific Biological Station, Canada Dan Ware, Nanaimo, BC, Canada Shin-ichi Ito, Tohoku National Fisheries Research Institute, Miyagi, Japan Dave Eslinger, NOAA Coastal Services Centre, USA Yasuhiro Yamanaka, Graduate School of Environmental Earth Science, Hokkaido, Japan Michio J. Kishi, Graduate School of Fisheries Sciences, Hokkaido, Japan Maki Aita-Noguchi & Lan Smith, Frontier Research Center for Global Change, Yokohama, Japan
Outline • Motivation: Charge to the PICES CCCC Model Task Team • Background on N. Pacific Ocean Dynamics • Modeling approach – NEMURO LTL & HTL • Example applications, model calibration and uncertainty analysis • Future work
PICES Climate Change & Carrying Capacity (CCCC) Program • Ultimate Goal…… • “to forecast the consequences of climate variability on the ecosystems of the subarctic North Pacific” • Acknowledges that long-period changes occur in the PICES region and assumes that changes in zooplankton biomass, productivity and species composition will lead to changes in the carrying capacity of the subarctic Pacific
1998 1925 1947 1977 Regimes and the Pacific Decadal Oscillation • an El Niño-like pattern of climate variability • 20 to 30 year periods of persistence in North American and Pacific Basin climate • warm extremes prevailed from 1925-46, and again from 1977-98; a prolonged cold era spanned 1947-76 Mantua, Hare, Zhang, Wallace and Francis, BAMS 1997
“Regimes” evident in HTL fish stocks (Rodinov and Overland, 2005))
CCCC Model Task Team Recommendations • Since comparison of 12 regional ecosystems is at the core of the CCCC, a prototype LTL model should be adopted to examine climate impacts • The prototype model should have a generalized structure that can correctly represent the characteristics of each system • Structural and formulation differences should be minimized • Prototype model will facilitate development of comparison protocols
Lower Trophic Level Modeling OBJECTIVE: Used as a tool to test the hypothesis that physical forcing factors regulate primary production and that the effect is apparent in zooplankton standing stock and then transferred to variation in higher trophic levels
NEMURO LTL • 1st workshop held in Nemuro Japan 2000 • Participants – physical oceanographers, biological oceanographers, fisheries oceanographers, fisheries biologists, oceanographic modelers, fisheries population dynamists, applied mathematicians • A consensus conceptual model was designed representing the minimum trophic structure and biological relationships between and among all the marine ecosystem components thought to be essential in describing ecosystem dynamics in the North Pacific • NEMURO-A compromise between generality and complexity
NEMURONorth Pacific Ecosystem Model for Understanding Regional Oceanography
NEMUROFeatures • 1D point model; 2 layers • 2 phytoplankton groups; 3 zooplankton groups • Fluxes calculated for nitrogen and silicate • Sinking of POM and Opal • Primary Production limited by nutrients (NO3 and NH4 via Michaelis-Menten), temperature (Q10), and light (self shading) • Grazing via Ivlev function and temperature influence (Q10) • Nutrient exchange between the deep and mixed layers • Forced by annual signals of light, SST and MLD • NO IRON
Links to the Physics and Climate • All biological rates mediated by sea temperature • Ontogenetic large zoop vertical migration (where appropriate based on local conditions of T and light) • Location specific physical variables • Seasonal light • Mixed layer depth • Nutrient flux from bottom layers • Air temperature for fish recruitment function • NPPI index for fish recruitment function • Water temperature for fish recruitment function • Prey fields (for static coupling) • Basin-scale climatology
Parameter sets were assembled for three areas of the North Pacific Ocean Apply the same model structure and climate scenarios to three different ecosystems – any observed differences in dynamic response will be due to locale characteristicsand forcing
Example of model results that include state variable dynamics (top panel) as well as time dependent dynamics of the diagnostic variables (bottom panel). Phyto P/B ratios Zoop P/B ratios Zoop C/B ratios Ecotrophic Efficiency
Linking the lower trophic level model to higher trophic levels Development of NEMURO.FISHNEMURO.For Including Saury and Herring
Rationale • Increasing appreciation of climate effects on fish growth, recruitment, and population dynamics • Observed “regimes” of varying productivity in exploited fish stocks • Recognition that effective management requires understanding and quantitative tools (models) for predicting climate effects on fish populations
Herring in the North Pacific • Extensive long-term data on size at age for multiple locations around the Pacific Rim • All life stages eat zooplankton • Life history and biology well known • Goals: • (1) better understand intra- and inter-population variation in herring growth and survival • (2) relate results to climate change and carrying capacity
Fish Bioenergetics Governing Equation W = weight (g ww) C = consumption (1/day) R = respiration S = SDA F = egestion E = excretion H = reproduction Calz – caloric value of prey Calf – caloric value of herring PD = prey density (1=ZS; 2=ZL; 3=ZP) V = vulnerability K = feeding efficiency
Respiration Process formulation different for age 0, 1 2+
Herring Population Dynamics • Age structured (11 age classes) • Stage structured (feeding and biological process description specific to ontogenetic stage, age 0, age 1, age 2+) • Realistic reproductive biology (closed life cycle) • Environment-dependent function to generate recruits • Age-specific maturity schedules • Age-specific fecundity schedules • Seasonal energy density of herring • Age-specific fishing removals and natural mortality
SSB - spawning stock biomass (g wet weight/m3) NPPI - North Pacific Pressure Index AIR - Air temperature SST - Sea surface temperature (Williams and Quinn. 2000. Fish Oceanogr 9: 300-315) YOY Recruitment
Benefits of Using Environment-Dependent SR Model • Produces observed autocorrelation in recruitment time series • Reproduces observed recruitment variation on annual and multi-decadal time scales • Closed life cycle allows the stock to become self-sustaining after initialization • More realistic compared to constant recruitment assumptions • Important feature for regime shift and climate change scenario hypotheses as it allows direct environmental effects on recruitment influencing top down control
Computations • Differential equations solved with 4th order Runge-Kutta numerical solution technique • dt=1 hour
Three Main Age Groups • Biological process do not simply scale with size/age. Sometimes there are different processes unique to a life stage….. • Age 0 (age of a recruit) • Age 1 (0-12 month) • Age 2+ (24 months and older) ~180g ww
Feeding ground in summer Fishing ground in autumn spawning ground in winter Life History of Pacific Saury with Oceanographic Features Oyashio Front Mixed water region spawning ground in spring & autumn Migration Kuroshio Extension Migration Modified from Watanabe et al. (1989)
Kuroshio MixedWater region Oyashio 3-box version Table 2. Life stages of Pacific saury in the saruy bioenergetics model Stage region larvae Kuroshio juvenile & young mixed region small Oyashio adult mixed region adult matured Kuroshio adult mixed region adult Oyashio adult mixed region adult matured Kuroshio 9 life stages Ito et al. (2004)
Interannual Forcing (SST) Oyashio Mixed Water Region Kuroshio JMA SST product (1deg x 1deg, 10days) 1950 - 2002
Two Example Applications • Dynamic mode • fish consumption removed from zooplankton, excretion adds NH4, and egestion adds PON • quasi-West Vancouver Island (WVCI) • Uncoupled mode • NEMURO imbedded a 3-D circulation model (Aita-Noguchi et al., 2004) • predicted temperature and zooplankton used to drive herring model
Latitudinal Variation in Herring Growth An Uncoupled Example • Used predictions of temperature and zooplankton density from NEMURO imbedded in a 3-D circulation model (Aita-Noguchi et al. 2004). • Data available from 1948-2002 • Look at regional response in herring growth. Do regime shifts cascade up the food web?
3D Model Background Physical model:CCSR Ocean Component Model (COCO) 3.4 (developed at Center for Climate System Research, University of Tokyo) Biological model:NEMURO LTL Configuration (same as Aita et al., 2003) Horizontal resolution : 1 degree * 1degree (360x180). Vertical resolution : 54 levels from the surface to the bottom (5000m). 5m for all layers within upper 100m. Mixed layer processes: Noh and Kim turbulent closure scheme. Boundary conditions (daily surface forcing) NCEP 6-hourly dataset from 1948 to 2002 : Sea surface temperature : Fresh water flux :Surface wind stress : Solar radiation Nitrate and Silicate concentrations: WOA 1998
NEMURO.FISH applied to four areas of the North Pacific Prince William Sound West Coast Vancouver Island Oregon Coast Hokkaido-Sakhalin
Dynamic Example • Calibrated NEMURO to field data on phytoplankton and zooplankton for WVCI • monthly concentrations • automated calibration with PEST software • Used historical environmental indices for recruitment (Williams and Quinn, 2000)
Model Calibration • NEMURO and NEMURO.FISH are complex models with many parameters (190) • Usually ad-hoc methods are used to calibrate ecological models where one “manually adjusts favorite parameters until a subjective good fit of predicted and observed values” • We want to apply NEMURO to multiple locations throughout the open ocean and also to coastal environments for coupling to herring, saury and other models. • Need an objective way to calibrate the model
PEST Automatic Calibration Software • Need only PEST setup files and an executable model • Variation of Gauss-Marquardt-Levenberg algorithm • Minimize the weighted sum of squared deviations between predicted and observed values • Relationship between model and parameters approximated by a Taylor series expansion, involves computing the Jacobian and Hessian matrices
PEST Setup Files Input Parameters PEST NEMURO Observations Output Variables
Calibration Data • West Vancouver Island: 1991-2001 • California Current • Wainwright et al. • Wang • Created a dataset of monthly values of nitrate, total phytoplankton, small zooplankton, large zooplankton, and predatory zooplankton