Download
1 / 7
70 likes | 94 Vues
Tutorial on creating reports, including pre-made reports and customization options. Learn how to filter, sort, and export reports.

E N D
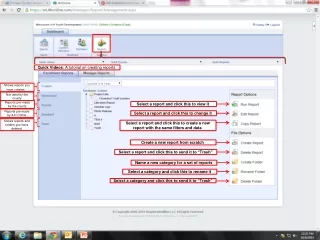
Quick Videos: A tutorial on creating reports. Shows reports you have created.s Not used by the county Reports pre-made by the county Select a report and click this to view it. Reports pre-made by 4-H Online Select a report and click this to change it. Shows reports and folders you have deleted. Select a report and click this to create a new report with the same filters and data. Create a new report from scratch. Select a report and click this to send it to “Trash” Name a new category for a set of reports Select a category and click this to rename it Select a category and click this to send it to “Trash”
Data to Display These lines represent what you want to know about the members who will appear in the report (e.g. names, ages, addresses, photo releases). Select a line and click the arrow to move it into the “Report” field. Arrow Click this after selecting a line to include it in your report Move Up/Move Down Select a line and change the order it will appear on the report. The top line will be the leftmost data column (we suggest this usually be Member Name) SAVE: Always click “Save” before moving on to the next screen. Your work will be lost if you simply click through the tabs above.
Filters These lines represent who you want to appear in your report (e.g. members enrolled in a certain project, members registered for a particular event). Select a line and click the arrow to move it into the “Report” field. Arrow Click this after selecting a line to include it in your report The Status Field If you do not check any boxes in a category, the report will behave the same as if you had checked all the boxes in that category (e.g. you do not have to check both “Male” and “Female” for the report to show both male and female members). The one exception is the Status Field. If you do not check any of these boxes, the program will assume you only want to view Active members. Checkboxes These are additional filters representing who you want to appear in your report. For example, by checking the “Adult” box, you will only see adults who meet any other criteria selected. DON’T FORGET TO HIT SAVE AT THE BOTTOM OF THE SCREEN BEFORE MOVING ON!
Custom Filters This allows you to create highly-specific filters for who you want to appear in you report. In this example, I have created a filter that will show me members who live in zip codes starting with the numbers “544.” The asterisk (*) is a wildcard, meaning I do not care what numbers might follow “544,” but that I acknowledge there should be numbers following 544. Grouping Click both “Enable” and “Page Break” to create a separate page for each family or member. This can be useful for reports with long lists of member-specific data, such as project enrollments. Sorting: Format your report to list members in an order based on the results they generate (e.g. selecting Member: Full Name (Last, First) in Descending order will produce a report in reverse alphabetical order). If you do not use this, the system will default to alphabetical or numeric order. Landscape: Check this box to orient the report along the long edge of the paper. This is useful for reports with a lot of columns (your selections on the “Report” tab). Save: You must save your work before advancing.
Grid View: This screen produces your report in a grid format without having to download a PDF, Excel Spreadsheet, or Rich Text file. Search: On long reports, you can click here to quickly search for a specific result. Export to Excel: Click here to quickly download a Microsoft Excel spreadsheet with the data you generated.
View Report: This screen shows you what your report would look like printed in PDF format. You can download or print your reports from this screen. Export: To download your report as a PDF, Excel Spreadsheet (XLS) or Rich Text file, select your option and then click the disk icon next to the drop-down menu.
Start At Cell: If you are printing on a partial sheet of labels, use this drop-down menu to shift your labels downward on the sheet. Correspondence: This screen produces 3 x 10 sheets of mailing labels for each member appearing in your report. The Family Correspondence will generate one label per family (e.g. a household with five enrolled members will only generate one label). The Member Correspondence will generate one label per individual (a household with five enrolled members will generate five labels, addressed specifically to each member). Export: To download your labels as a PDF, Excel Spreadsheet (XLS) or Rich Text file, select your option and then click the disk icon next to the drop-down menu.