Aquatic Ecology
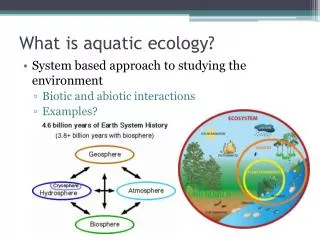
Aquatic Ecology. Ocean. Notes given in class: Estuary – definition & importance Mangroves Other oceanic zones. Lakes/Ponds. Littoral Zone: Limnetic Zone: Profundal Zone:. Thermal Stratification. Lakes are divided into layers based on their temperatures.


Aquatic Ecology
E N D
Presentation Transcript
Ocean • Notes given in class: • Estuary – definition & importance • Mangroves • Other oceanic zones
Lakes/Ponds • Littoral Zone: • Limnetic Zone: • Profundal Zone:
Thermal Stratification • Lakes are divided into layers based on their temperatures. • The higher temperature, the less dense the water is • Warmer water stays on top, colder water sinks to the bottom
Thermal Stratification • Mixed Layer – high in DO, low in nutrients • Thermocline – acts as a barrier • Deep water – low DO, high in nutrients
Fall Turnover • As the temperatures begin to drop, the surface layer becomes more dense, and it sinks to the bottom. This mixing brings nutrients from the bottom up to the surface and sends oxygen to the bottom.
Spring Turnover • As top water warms and ice melts, it sinks through and below the cooler, less dense water, sending oxygen down and nutrients up.
Rivers • Watershed • Eutrophication • Dams
Freshwater Streams and Rivers:From the Mountains to the Oceans • Water flowing from mountains to the sea creates different aquatic conditions and habitats. Figure 6-17
Headwater Stream Characteristics • A narrow zone of cold, clear water that rushes over waterfalls and rapids. Large amounts of oxygen are present. Fish are also present. Ex. trout.
Downstream Characteristics • Slower-moving water, less oxygen, warmer temperatures, and lots of algae and cyanobacteria.
USING DAMS AND RESERVOIRS TO SUPPLY MORE WATER • Large dams and reservoirs can produce cheap electricity, reduce downstream flooding, and provide year-round water for irrigating cropland, but they also displace people and disrupt aquatic systems.
Provides water for year-round irrigation of cropland Flooded land destroys forests or cropland and displaces people Large losses of water through evaporation Provides water for drinking Downstream cropland and estuaries are deprived of nutrient-rich silt Reservoir is useful for recreation and fishing Risk of failure and devastating downstream flooding Can produce cheap electricity (hydropower) Downstream flooding is reduced Migration and spawning of some fish are disrupted Fig. 14-13a, p. 317
Powerlines Reservoir Dam Powerhouse Intake Turbine Fig. 14-13b, p. 317
Colorado River Basin • These are dams & reservoirs that feed from the Colorado River all the way to San Diego, LA, Palm Springs, Phoenix & Mexico. So far has worked because they haven’t withdrawn their full allocations.
The Colorado River Basin Figure 14-14
IDAHO WYOMING Dam Aqueduct or canal Salt Lake City Upper Basin Denver Grand Junction Lower Basin UPPER BASIN UTAH Colorado River NEVADA Lake Powell COLORADO Grand Canyon Glen Canyon Dam Las Vegas NEW MEXICO Boulder City CALIFORNIA Los Angeles ARIZONA Albuquerque LOWER BASIN Palm Springs 0 100 mi. Phoenix San Diego Yuma 0 150 km Tucson Mexicali All-American Canal MEXICO Gulf of California Fig. 14-14, p. 318
Case Study: The Colorado Basin – an Overtapped Resource • The Colorado River has so many dams and withdrawals that it often does not reach the ocean. • 14 major dams and reservoirs, and canals. • Water is mostly used in desert area of the U.S. • Provides electricity from hydroelectric plants for 30 million people (1/10th of the U.S. population).
Case Study: The Colorado Basin – an Overtapped Resource • Lake Powell, is the second largest reservoir in the U.S. • It hosts one of the hydroelectric plants located on the Colorado River. Figure 14-15
Case Study: China’s Three Gorges Dam • There is a debate over whether the advantages of the world’s largest dam and reservoir will outweigh its disadvantages. • The dam will be 2 kilometers long. • The electric output will be that of 18 large coal-burning or nuclear power plants. • It will facilitate ship travel reducing transportation costs. • Dam will displace 1.2 million people. • Dam is built over seismatic fault and already has small cracks.
Dam Removal • Some dams are being removed for ecological reasons and because they have outlived their usefulness. • In 1998 the U.S. Army Corps of Engineers announced that it would no longer build large dams and diversion projects in the U.S. • The Federal Energy Regulatory Commission has approved the removal of nearly 500 dams. • Removing dams can reestablish ecosystems, but can also re-release toxicants into the environment.
Eutrophication • Too Much of a Good Thing!! • Excess nitrates and phosphates are released into a river (ranches, farms, water treatment plants, etc…) • These excess nutrients reach the lake or ocean (nutrients = euphotic = good!) • Excess nutrients are VERY good for algae • Algal growth increases to the point that an algal bloom forms over the water • Much less light can now get through this algal bloom • Plants die • Herbivores die • Carnivores die/leave the area • FYI – this is a VERY important concept
Core Case Study: Lake Victoria • Lake Victoria has lost their endemic fish species to large introduced predatory fish. Figure 12-1
Core Case Study: A Biological Roller Coaster Ride in Lake Victoria • Reasons for Lake Victoria’s loss of biodiversity: • Introduction of Nile perch. • Lake experienced algal blooms from nutrient runoff. • Invasion of water hyacinth has blocked sunlight and deprived oxygen. • Nile perch is in decline because it has eaten its own food supply.
Aquifers • Underground water source • Aquifers do recharge, but often the recharge rate is much less than the depletion rate • Aquifer depletion has the following negative consequences: • Loss of water source • Salt water may seep into aquifer • Loss of native species • Ground collapse
Aquifers • An aquifer is an underground water sources • Aquifers have a recharge rate • Usually the recharge rate is much slower than the depletion rate • Running out of water!
Other Effects of Groundwater Overpumping • Sinkholes form when the roof of an underground cavern collapses after being drained of groundwater. Figure 14-10
Groundwater Depletion: A Growing Problem • Areas of greatest aquifer depletion from groundwater overdraft in the continental U.S. • The Ogallala, the world’s largest aquifer, is most of the red area in the center (Midwest). Figure 14-8
Ogallala Aquifer • This is the world’s largest known aquifer, and fuels agricultural regions in the U.S. It extends from South Dakota to Texas. It’s essentially a non-renewable aquifer from the last ice age with an extremely slow recharge rate. In some cases, water is pumped out 8 to 10 times faster than it is renewed. Northern states will still have ample supplies, but for the south it’s getting thinner. It is estimated that ¼ of the aquifer will be depleted by 2020.
Agriculture • Agriculture is the LEADING cause of wasted water. • Solution – more efficient irrigation techniques • Hurdles – expense, education
Drip irrigation (efficiency 90–95%) Gravity flow (efficiency 60% and 80% with surge valves) Center pivot (efficiency 80%–95%) Above- or below-ground pipes or tubes deliver water to individual plant roots. Water usually pumped from underground and sprayed from mobile boom with sprinklers. Water usually comes from an aqueduct system or a nearby river. Fig. 14-18, p. 325
Fishing • Deadliest Catch
Fishing Problems & Techniques • The major decline in the worldwide catch of fish since 1990 is because of over-fishing. • By-catch- fish or animals that were not meant to be caught.
Overfishing and Extinction: Gone Fishing, Fish Gone • About 75% of the world’s commercially valuable marine fish species are over fished or fished near their sustainable limits. • Big fish are becoming scarce. • Smaller fish are next. • We throw away 30% of the fish we catch. • We needlessly kill sea mammals and birds.
Trawler fishing Fish farming in cage Spotter airplane Sonar Purse-seine fishing Trawl flap Trawl lines Fish school Trawl bag Drift-net fishing Long line fishing Buoy Float Lines with hooks Deep sea aquaculture cage Fish caught by gills Fig. 12-A, p. 255
Trawler Fishing • Catches shrimp, shellfish, flounder and other anials that live on the ocean floor • Drags a funnel shaped net along the ocean floor, weighted down with chains or metal plates • Some nets are large enough to hold 12 jumbo jets!!
Purse Seines • A large purse-like net is put into the ocean and is then closed like a drawstring purse to trap the fish. • Tuna is a fish typically caught in purse seines • Dolphins are a by-catch of purse seines
Long-line fishing • Lines are put out that can be up to 80 miles long w/ thousands of baited hooks on them. These are left out free-floating for days and then the boat comes back and picks them up. • Pilot whales, dolphins, sea turtles, and birds are by-catch of this technique. • Deadliest Catch
Drift-net fishing • Each net hangs as much as 50 feet below the surface and up to 34 miles long. • Anything that comes into contact w/ these nearly invisible nets are entangled. • This leads to overfishing • Many unwanted fish and marine mammals, turtles and seabirds are caught.
Regulations on Fishing • Marine and mammal protection act - provides for protection and conservation of marine mammals • Magnuson Act- Sets quotas, size limits and seasons for fishing • UN Law of the Seas – allows countries to establish fishing quotas • Marine Sanctuaries Act- provides protected habitat for marine organisms
Other human impacts on water • Salinazation (Aral Sea) • Deforestation • Development (florida everglades)
TOO MUCH WATER • Human activities have contributed to flood deaths and damages. Figure 14-23
After Deforestation Tree plantation Evapotranspiration decreases Roads destabilize hillsides Ranching accelerates soil erosion by water and wind Winds remove fragile topsoil Gullies and landslides Agricultural land is flooded and silted up Heavy rain leaches nutrients from soil and erodes topsoil Rapid runoff causes flooding Silt from erosion blocks rivers and reservoirs and causes flooding downstream Fig. 14-23b, p. 330
Examples • Examples include drought and expanding deserts.
Overdrawing Surface Water • Lake levels drop, recreation use drops, fisheries drop, and salinization occurs. Ex. Soviet Union (Aral Sea); the inland sea drained the river that fed into it. Now it’s a huge disaster (read pg. 322 in text). 1997 1964
Case Study: The Aral Sea Disaster • Diverting water from the Aral Sea and its two feeder rivers mostly for irrigation has created a major ecological, economic, and health disaster. • About 85% of the wetlands have been eliminated and roughly 50% of the local bird and mammal species have disappeared. • Since 1961, the sea’s salinity has tripled and the water has dropped by 22 meters most likely causing 20 of the 24 native fish species to go extinct.
Mono Lake • (like the Dead Sea) This has a huge salt concentration due to man’s draining.
Salinization of Irrigated Soil • Water is poured onto soil and evaporates. Over time, as this is repeated, nothing will grow there anymore.