Download
1 / 17
170 likes | 329 Vues
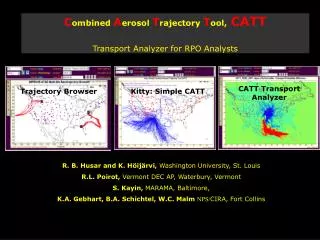
C ombined A erosol T rajectory T ool, CATT Status Report on Tools Development and Use. CATT Transport Analyzer. Trajectory Browser. Kitty: Simple CATT. Project supported by the Inter-RPO Data Analysis Workgroup Project Manager: Serpil Kayin, MARAMA

E N D
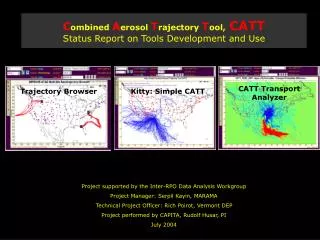
Combined Aerosol Trajectory Tool,CATTStatus Report on Tools Development and Use CATT Transport Analyzer Trajectory Browser Kitty: Simple CATT Project supported by the Inter-RPO Data Analysis Workgroup Project Manager: Serpil Kayin, MARAMA Technical Project Officer: Rich Poirot, Vermont DEP Project performed by CAPITA, Rudolf Husar, PI July 2004
AEROSOL CATT-In CAPITA Aerosol Sensors Aerosol Data Integrated AerData TrajData Cube Aggreg.Aerosol Collection IMP. EPA Assimilate NWS Trajectory ARL Integration VIEWS CATT Weather Data Gridded Meteor. Traject.Data Aggreg. Traject. Next Process AerData Cube CATT-In CAPITA TRANSPORT Next Process
New CATT Components: Chemical filter Accomplished through queries to chemical data sets. The output a list of “qualified” dates for a specific location (s). Trajectory Aggregator Tool Inputs: • Receptor location. Single location; multiple receptors; weighed multi-site • Receptor times. Time range for each site • Temporal filter/weight conditions. Date range; specific dates; weights for each date • Trajectory input files. Pre-computed or on the fly calculated (e.g. HYSPLIT, ATAD etc) • Trajectory aggregation metrics. Endpoint counts, residence time, incr. probability TAT Output: • XMLGrid, GIS layers, ASCII point • Rendered contour images of transport metric Trajectory aggregator Receives the list of dates for a specific location Performs the trajectory/restime aggregation Yield transport pattern for specific receptor location and chemical filter conditions.
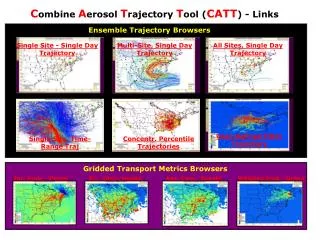
The CATT Family • IMPROVE-ATAD Trajectory Browser Tool • This tool is used to find the airmass history for an IMPROVE site and time • TrajAgg- Trajectory Aggregator (Grid) • Uses user-defined filter (locations and dates) to aggregate trajectories • Kitty – Simple Combined Aerosol Trajectory Tool • Limited filtering and aggregation for IMPROVE-ATAD data • CATT - Combined Aerosol Trajectory Tool (Threshold, Percentile, Ratio) • Full featured chemical-transport exploration tool
IMPROVE-ATAD Trajectory Browser ToolThis tool sows the backtrajectory for any day (1988-2003) and ATAD lactation (432 sites, 177 IMPROVE, 256 STN) • Click on location or select from site location list • Enter date into the Time box or use the navigation buttons, |< < > >| http://webapps.datafed.net/dvoy_services/datafed.aspx?view=atadv_map
TrajAgg- Trajectory Aggregator – User Defined Filter This tool performs weighed trajectory aggregation using user-supplied filter The filter can be submitted as a comma separated CSV table, shown here The aggregator returns either trajectory or weighed contour plots
Kitty – Simple CATTCombined Aerosol Trajectory Tool • All the VIEWS chemical parameters available for filtering • Filter settable as Parameter-Operator-Threshold, e.g. SOILf >20 or SO4<5
Differing TrajPoint weight combinations • These were all created using the CATT Aerosol Trajectory Aggregator Uncertainty potential further away
The Role of Age Weighing: Example: Fine SOIL Transport Probability map to Shenandoah, July Age weight factor = 1 Hi weighed restime near the receptor Factor ~ square root of age Weighed restime uniform along path Recommended (why? Don’t know) Factor ~ age Hi weighed restime far from receptor
Transport Probability Metrics • The transport metric is calculated from two residence time grids, one for all trajectories and another for trajectories on selected (filtered days). Both residence time grids are normalized by the sum of all resdence times in all grid cells: pijf=rij/SS rij pija=rij/SS rij • pijf, is the filtered and pijais the unfiltered residence time probability that an air masses passes through a specific grid. There is a choice of transport probability metrics: • The Incremental Residence Time Probability (IP) proposed by Poirot et al., 2001 is obtained by subtracting the chemically filtered grid from the unfiltered residence time grid, IRTP = pijf - pija • The other metric is the Potential Source Contribution Function (PSCF) proposed by Hopke et al., which is the ratio of the filtered and unfiltered residence time probabilities, PSCF = pijf / pija
Incremental Transport Probability Analysis Backtrajectories for all days, Jun, Jul, Aug Backtrajectories for top 10 percentile Soil, Jun, Jul, Aug Upper Buffalo IMPROVE Site • In the Incremental Probability Map, red areas represent high probability transport path • Blue zones represent the regions where a species are NOT coming from • First, the trajectories for top 10 percent SOILf are calculated • Next, the trajectories for all days are calculated • Thirdly, the • Trajectory endpoints are gridded • Each grid is normalized to probability • The all-data grid is subtracted from filtered grid Incremental Transport Probability, Jun, Jul, Aug
Fine SOIL transport at decreasing concentration limit Dust > 30 ug/m3 Dust > 15 ug/m3 Dust > 7.5 ug/m3 Dust > 3.7 ug/m3 Dust > 1.8 ug/m3 Dust > 1.8 ug/m3 Weight by 1 Calc high Percent days
Incremental Probability MapsUpper 10 percentile,Big Bend, Jun, Jul Aug • Incremental Transport Probabilities for Big Bend indicate southerly transport of species, except sulfate • Conspicuously, in the summer, nitrate is also transported from the south
Incremental Probability MapsUpper 10 percentile,Brigantine, Jun, Jul Aug Incremental Transport Probabilities for Brigantine indicate westerly transport of species Soil is preferentially transported from southwest; nitrate is transported from the northwest
Project Status:Extensions to the CATT Analysis Tool • Connectivity to VIEWS chemical datasets • Done • Flexible import of pre-calculated back-trajectory data • Done for ATAD • Additional chemical filtering and trajectory aggregation algorithms • Done for some, may add some filters • Spatial interpolation and rendering (contouring) of point data • Done • CATT server hardware and software installation and maintenance • Done