Download
1 / 1
10 likes | 124 Vues
highlands. backward. ID: 1495593 P43B-1931. Table 1: Average blast zone measurements and reflectance values for each landing site. Average I/F values are for phase angles of ~30 ° . mare. (b) Luna. (a) Apollo. (c) Surveyor. III. Methods. IV. Results and Observations. I. Background.

E N D
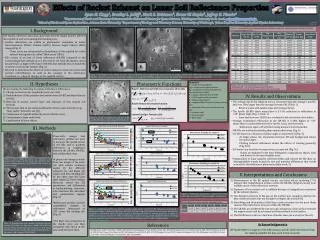
highlands backward ID: 1495593 P43B-1931 Table 1: Average blast zone measurements and reflectance values for each landing site. Average I/F values are for phase angles of ~30°. mare (b) Luna (a) Apollo (c) Surveyor III. Methods IV. Results and Observations I. Background References [1] Hapke, B., and H. Van Horn, (1963), JGR, 68, 4545. [2] KaydashV. et al. (2010), Icarus, 211, 89-96. [4] Goguen J.D. et al. (2010), Icarus, 208, 548-557. [5] Lucey, P. et al. (2006), New Views of the Moon, 84-219. [6] Hapke, B. et al. (2012), JGR, 117. [7] Metzger, P. et al. (2010), Lunar Settlements, 551-576.[8] Immer, et al. (2011), Icarus, 211, 1089–1102. [9] Metzger, P. et al. (2011), JGR, 116,E06005. • The Apollo, Surveyor, and Luna spacecraft descent engine plumes affected the regolith at and surrounding their landing sites. • Surface alterations are visible as photometric anomalies in Lunar Reconnaissance Orbiter Camera (LROC) Narrow Angle Camera (NAC) images (Fig. 1). • These areas are interpreted as disturbance of the regolith by rocket exhaust during descent, called “blast zones” (BZs). • BZs consist of an area of lower reflectance (LR-BZ) compared to the surroundings that extends up to a few meters out from the landers, and a broader halo of higher reflectance (HR-BZ) that extends tens to hundreds of meters out from the landers (Fig. 2). • We seek to determine the effects of rocket exhaust in terms of erosion and particle redistribution, as well as the cause(s) of the reflectance variations, i.e., physical changes at the regolith surface. • Phase-ratio images and reflectance profiles are used to measure the spatial extent of the BZs and to quantify differences in brightness between the LR-BZs, HR-BZs, and undisturbed areas. • A phase-ratio image is made from two images of the same site with similar incidence angles (i) but different emission (e) and phase (g) angles, and then dividing one by the other over the same pixel range [2]. These images distinctly reveal the BZ parameters and differences in backscattering character-istics between the disturbed and undisturbed regions (Fig. 3). • Reflectance profiles provide quantitative changes in reflectance (measured as I/F) across the landing site (Fig. 4). • The blast zone properties at the Apollo sites are then compared with those at the Luna and Surveyor sites. • The average Apollo BZ elliptical area is 10x larger than the average Luna BZ, and over 100x larger than the average Surveyor BZ (Table 1). • BZ area scales with lander mass and average thrust. • The Apollo LR-BZs (dark areas) have a 2-14% reduction in reflectance at ~30° phase angle (Fig. 2, Table 1). • Luna and Surveyor LR-BZs are confined to the area below the landers. • Average normalized reflectance in the HR-BZs is 2-16% higher at ~30° phase than in undisturbed areas (for Apollo, Luna, and Surveyor). • Reflectance tapers off with increasing distance from the lander. • HR-BZs are less backscattering than undisturbed areas (Fig. 3) • I/F decreases as a function of phase angle, as expected [4] (Fig. 5). • At larger phase, the separation between BZ and background values becomes larger. • Plotting reduced reflectance masks the effects of viewing geometry (Fig. 5d-f). • I/F varies as a function of composition, as expected (Fig. 5c). • Values are highest for the most feldspathic compositions (Ap16, L20) and lowest for the most basaltic sites. • Examination of lunar samples collected within and outside the BZ show no distinguishable trends in particle size and maturity differences that would account for the reflectance phenomena [this work, 5]. Effects of Rocket Exhaust on Lunar Soil Reflectance PropertiesRyan N. Clegg1, Bradley L. Jolliff1, Mark S. Robinson2, Bruce W. Hapke3, Jeffrey B. Plescia41Department of Earth and Planetary Sciences and the McDonnell Center for Space Sciences, Washington University in St. Louis, rclegg@levee.wustl.edu,2School of Earth and Space Exploration, Arizona State University, 3Department of Geology and Planetary Science, University of Pittsburgh, 4Johns Hopkins University Applied Physics Laboratory Figure 1: NAC images of the Apollo, Surveyor, and Luna landing sites, cropped to the region around the landers. Dashed lines outline the outer extent of each blast zone (HR-BZ). Insets are zoomed in on the lander. a) Apollo 14, image M11406206L. b) Luna 23, image M174868307R. c) Surveyor 1, image M122495769L. Photometric Functions II. Hypotheses aApollo 12 measurements include Surveyor Crater bNormalized I/F = IoF_bz/IoF_background (for HR-BZs) cCalculatedfrom average Apollo, Luna, and Surveyor thrust values We are testing the following to explain reflectance differences: Change in macroscopic roughness (cm to m scale). Redistribution of fine particles (excavation from LR-BZ and deposition to HR-BZ). Removal of mature surface layer and exposure of less mature soil beneath. Microscopic (nm to μm scale) modification of fine-scale structure (e.g., “fairy castle” structure, see [1]). Compaction of regolith within the more reflective area. Contamination from rocket fuel. Combination of these effects. (d) (a) (b) forward Figure 3: Ratio image for Apollo 14 compared with original NAC image. (a) NAC image, M11406206L. Inset shows viewing geometry. (b) M114064206L divided by M114071006L. V. Interpretations and Conclusions • Measurement of the BZ spatial extents and blast effects modeling [7-9] indicate that redistribution of fines within the HR-BZs (brighter areas) is an unlikely cause of the reflectance increase. • Exposure of less mature soil is unlikely because of insignificant excavation by the exhaust plumes. • The dynamic pressure of the gas on the surface was enough to destroy the fairy-castle structure, but not enough to compact the surface [9]. • Smoothing and destruction of the fairy-castle structure are the most likely causes of the reflectance increase within the HR-BZs. • The LR-BZs are darkened by macroscopic disruption of the surface beneath the engine nozzle and by astronaut activity proximal to the landers. • The HR-BZ area scales as a function of lander mass (as a proxy for thrust). Parameters w= single scattering albedo p(g) = single particle phase function Bco= amplitude of Coherent Backscatter Opposition Effect (CBOE) Bc= angular shape function of CBOE hc = CBOE angular width parameter S = shadowing parameter b = angular width of forward or backscattering lobe c= magnitude of forward or backscattering lobe i= incidence angle e = emission angle g = phase angle *Bold variables are key parameters (c) Hapke’s Bidirectional Reflectance Equation (from [6]) Double Henyey-Greenstein Function: Lommel-Seeliger Function (LS): (e) Figure 4: Example reflectance profiles. Solid lines indicate average I/F within the blast zone, dashed lines indicate average I/F for the background. a) Apollo 11, NAC image M150361817R. b) Luna 23, NAC image M106468527R. c) Surveyor 1, NAC image M122495769L. feldspathic Figure 6: Preliminary photometric model fitted to BZ reflectance for Apollo 12 (top) and Apollo 16 (bottom). basaltic Figure 2: Apollo 11 landing site, with the LR-BZ and HR-BZ outlined. NAC image M150361817R. Table 2: Parameter values used for modeling in Fig. 6 (f) (f) Figure 5: a) Reflectance (I/F) as a function of phase angle (g) for the BZs. b) BZ reflectance, normalized to background values. c) Reduced reflectance (IoF/LS), showing compositional differences between landing sites. d) Apollo 12 reflectance versus incidence angle (i), showing the effects of viewing geometry. e) Apollo 12 reflectance versus g. f) Apollo 12 reduced reflectance as a function of g, which masks the effects of viewing geometry and shows increased separation between BZ and background I/Fvalues at higher phase. Acknowledgments We thank NASA for support of the LRO mission and the LROC Operations Team for making available the data used in this research.