Download
1 / 6
60 likes | 191 Vues
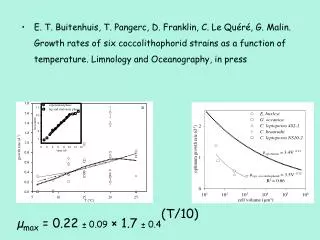
E. T. Buitenhuis, T. Pangerc, D. Franklin, C. Le Quéré, G. Malin. Growth rates of six coccolithophorid strains as a function of temperature. Limnology and Oceanography, in press. µ max = 0.22 ± 0.09 × 1.7 ± 0.4 (T/10). 31 µmol/kg. 15-30% sinks daily: 70-85% remains in UML

E N D
E. T. Buitenhuis, T. Pangerc, D. Franklin, C. Le Quéré, G. Malin. Growth rates of six coccolithophorid strains as a function of temperature. Limnology and Oceanography, in press µmax = 0.22 ± 0.09 × 1.7 ± 0.4(T/10)
15-30% sinks daily: 70-85% remains in UML If there’s a POC/PON signal it should be observable in the UML enhanced sinking from the surface layer, where POC/PON is the same, would lead to enhanced N drawdown
Dilution by rainwater? ΔDICFF-P = 129 µmol/kg ΔDICFF-P = 31 µmol/kg 31/129*16m3 ~ 4m3 Egge & Aksnes 1992
Leakage of air? ΔDICFF-P = 31 µmol/kg*1.023kg/L*15632L /7d/24h/d/60min/h/(1050-380ppm)*22.4L/mol = 1.6 L air/min Egge & Aksnes 1992