Download
1 / 37
370 likes | 502 Vues
Exploring lakes and dune features on Titan surface through SAR images and electromagnetic models. M. Callegari (1) , D. Casarano (2 ) , C. Notarnicola (1 ) , L. Pasolli (1) , B.Ventura (1) , (1) Institute for Applied Remote Sensing, EURAC Bolzano, Italy.

E N D
Exploring lakes and dune features on Titan surface through SAR images and electromagneticmodels M. Callegari(1), D. Casarano(2) , C. Notarnicola(1) , L. Pasolli(1), B.Ventura(1), (1)Institute for Applied Remote Sensing, EURAC Bolzano, Italy. (2)CNR-IRPI, Via Amendola 122 I, Bari, Italy, VII RiunioneAnnualeCeTeM-AIT, Bari, 4-5 Dicembre 2012
Outline Analysis of Titan’s Ontario lake bathymetry with SAR data using e.m. models and Bayesian inversion algorithms EstimationofopticalthicknesswithBayesianinversionmethods also allowingtoobtainincertitudeestimation Study oftheeffectofthehypotheses on wavemotion, withthepossibilitytoconstrainlikely wind speedranges Physicaldepthmapsbased on losstangentestimationperformedintegrating SAR andaltimeterdata Error budget SAR dataprocessing on Titan‘sdunefieldsforphysical-morphologicalparameterretrieval Discussionofthehypothesisofdunehomogeneity Estimationofphysical-morphologicaldunefieldparametersmerginginformationfrom SAR imagesacquiredwith different geometry VII RiunioneAnnualeCeTeM-AIT, Bari, 4-5 Dicembre 2012
The Cassini mission The Cassini mission is a cooperative project between NASA (National Aeronautics and Space Administration), ESA (European Space Agency) and Italian Space Agency (ASI). Cassini was launched on October 15th, 1997 by a TitanIV/Centaur Rocket. Cassini has travelled at an average speed of about 16.4 kilometres per second and covered a distance of about 3474 million kilometres In order to reach the Saturnian’s system on July 1st, 2004. The Cassini Mission initially foreseen until 2008, has been extended to 2012 (XX) and now until 2018 (Solstice Mission). VII RiunioneAnnualeCeTeM-AIT, Bari, 4-5 Dicembre 2012
The Cassini Radar Instrument Description Radar modes: • Altimeter: topographical profiles4.25 MHz bandwidth,24 to 27 km horizontal, 90 to 150 m vertical resolution • Scatterometer: radar reflectivity of Titan’s surface0.1 MHz bandwidth, 10 to 200 km resolution • Radiometer: surface emissivity and dielectric constant of superficial features 135 MHz bandwidth, 7 to 310 km resolution • SAR: construction of visual images of the target surface0.45 MHz and 0.85 MHz bandwidth, 0.35 to 1.7 km resolution Peak power:86 W Frequency:13.78 GHzData rates:1 kbps: Radiometer only 30 kbps: Altimeter and Scatterometer/Radiometer 365 kbps: SAR Imaging/Radiometer VII RiunioneAnnualeCeTeM-AIT, Bari, 4-5 Dicembre 2012
Typical Titan’s flyby VII RiunioneAnnualeCeTeM-AIT, Bari, 4-5 Dicembre 2012
Titan’s wide variety of surface features VII RiunioneAnnualeCeTeM-AIT, Bari, 4-5 Dicembre 2012
T57-58-65: Ontario lake In the T57 an important lake area (16000 km2) was first detected in the Southern polar region. Altimetry data offer strong evidence that Ontario Lacus is a basin filled with liquid. Detected heights reveal a flat lake surface. Individual echoes show very strong specular reflection, thus an extremely flat lake surface, with <3 mm rmsheightvariationover 100‐meter lengths [Wyeet al., 2009]. If wind‐wave generation theories [e.g., Ghafoor et al., 2000; Notarnicolaet al., 2009; Lorenzet al., 2005] apply under Titan conditions, then either the winds were very weak (<0.3 m/sec [Notarnicola et al., 2009] during the altimetry observation, or the liquid material is much more resistant to wave generation than previously thought [Wyeet al., 2009]. FromWallet al., 2010 VII RiunioneAnnualeCeTeM-AIT, Bari, 4-5 Dicembre 2012
Ontario lakebathymetry Objective: To investigate lakebathymetryconsidering the effect of the hypotheses on boundaryconditions, to retrievealsopossibleconstraint to theseparameters, in particularwindspeed VII RiunioneAnnualeCeTeM-AIT, Bari, 4-5 Dicembre 2012
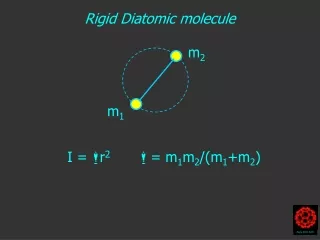
Modellingscatteringfromliquidsurfaces Pi i air lake t Total liquid depth l ground g VII RiunioneAnnualeCeTeM-AIT, Bari, 4-5 Dicembre 2012
is the bistatic single-scatter surface model for pp polarization based on the integral equations with simplified Green’s function; • W(n) is the Fourier transform of the n-th power of the surface correlation coefficient; • S(J,Js) is the bistatic shadowing function as defined by Sancer; • is a function of k and of the field coefficients, fqpand Fqp that are in turn function of the Fresnel’s coefficient,J and j. Electromagnetic models I Integral Equation Model VII RiunioneAnnualeCeTeM-AIT, Bari, 4-5 Dicembre 2012
Bragg scattering (incidence angles exceeding 20°) where apqis the Fresnel’s coefficient; describes the normalized wave spectrum. Facets scattering (low incidence angles) where Rpp is the Fresnel’s coefficient; is the RMS slope. Electromagnetic models II VII RiunioneAnnualeCeTeM-AIT, Bari, 4-5 Dicembre 2012
Gravitywave (k<10 kp) Capillary wave (k>10kp) is the directional spectrum (c = azimuth angle); n introduces kinematic viscosity; a is function of surface tension, gravity and wave number describing the transition between gravity and capillary regimes. Electromagnetic models III Gravity-capillary wave description: Donelan-Pierson model To model the electromagnetic scattering from this liquid layer, wave spectra have been described with Donelan-Pierson model. Kinematic viscosity, density, surface tension, needed for the capillary wave description are taken into account. VII RiunioneAnnualeCeTeM-AIT, Bari, 4-5 Dicembre 2012
J and Jt are respectively the incident and the transmitted angles; • Tpp the Fresnel power transmission coefficient; • 0gr is the scattering from bottom surface that has been modelled by using the IEM model; • is the liquid optical thickness: Electromagnetic models IV Double layer scattering: - the first component, derived from liquid surface, is modelled considering Bragg and facets scattering; • the second is determined by non-coherent scattering from bottom boundary surface attenuated by the liquid layer, approximated by using the IEM model and by accounting for crossing of thetop surface boundary and attenuation due to propagation loss through the layer. VII RiunioneAnnualeCeTeM-AIT, Bari, 4-5 Dicembre 2012
E:M: modelling and Bayesian inversion application to lake depth estimation Inversion techniques Sensor Acquisitions Titan features hyphoteses/ measurements 0 (TB) Probability density functions for surface parameters and related uncertaintes E.M. Models 0 sim (TB, sim) Comparison and Possible ranges for Surface parameters VII RiunioneAnnualeCeTeM-AIT, Bari, 4-5 Dicembre 2012
Inversionalgorithm Bayes’ theorem allows to turn the probability of calculated trend (generated by models in the training phase) into probability of the associated parameters set. The estimationofnoise (error) functionsis the mainobjectiveof the training phase. In fact, the noisefunction, due to the presenceof the natural target variability, the experimentaluncertainties and the approximationof the assumptions in the e.m.scatteringmodels and target properties, inferred in thisphaseisassumedvalidalso in the test phase VII RiunioneAnnualeCeTeM-AIT, Bari, 4-5 Dicembre 2012
Itcan beassumedthat the associatedtargets can beclassified in differentgroups, eachonecharacterizedbyhomogeneousproperties. In this case, the objectiveistoobtainsurfaceparameterspdfs estimate foreach target class. For Titan lakes of T16-T19, itwasassumed (asstatedby the e.m. model results) thatthe capillary wave contribution wassmallerwith respect to the bottom contribution, and the 0 values were depending only on the incidence angle and the optical thickness. Lakes were grouped in three classes, based on their 0 values in each interval of incidenceangles (itwas assumed that the optical thickness distribution was independent on the incindence angle) VII RiunioneAnnualeCeTeM-AIT, Bari, 4-5 Dicembre 2012
Opticalthicknessmapsfor Ontario lake b a c d Optical thickness map obtained with Notarnicola et al., (2009) model when εg= 3.1, vwind=0, 0.5, 0.8 and 1.0 m/s a, b,c,d) VII RiunioneAnnualeCeTeM-AIT, Bari, 4-5 Dicembre 2012
Hypotheses on wind speedsandeffect on lakedepthestimation The hypothesis of v>0.7 m/s leads to opticalthicknessestimatescorresponding to totalattenuation of scattering from lake bottom, also on areas with scatteringcoefficientssignificantlyhigherthan the lakeinnermostareas A maximum limit of 0.7 m/s iscompatible with the outputs of circulationmodels (Schneider et al., 2012). VII RiunioneAnnualeCeTeM-AIT, Bari, 4-5 Dicembre 2012
Ontario lakebathymetry Depth map of Ontario lake obtained using the Pb model when null wind speed and =3.1 (a); wind speed of 0.7 m/s and =4.5 (b). These two extreme cases indicates that the higher is the wind speed the weaker is the scattering response from the bed ItisassumedthelosstangentvalueestimatedbyPaillou et al. (2008) and also confirmedby Hayes et al. (2010) obtainedwiththeintegrationof SAR andaltimeterdata (3.7-8.7 10-4) VII RiunioneAnnualeCeTeM-AIT, Bari, 4-5 Dicembre 2012
Error estimation on lakebathymetry VII RiunioneAnnualeCeTeM-AIT, Bari, 4-5 Dicembre 2012
…includinguncertainties in pdf VII RiunioneAnnualeCeTeM-AIT, Bari, 4-5 Dicembre 2012
Next steps • Loss tangentestimationusingaltimeterdataandbayesianalgorithm in ordertoderive an independentvalue • Bathymetrymaps on otherlakeareas • Completeevaluationoferrorbudgetusing all themajorcomponenets such asbayesianinversiontechniques, constrains on physicalparameters. • Possiblechangedetectionfromnewacquisitions on lakesincludingsynergybetween SAR andradiometricdata VII RiunioneAnnualeCeTeM-AIT, Bari, 4-5 Dicembre 2012
Titandunes • [1] Le Gall, et al.,"Cassini SAR, radiometry, scatterometry and altimetry observations of Titan's dune fields," Icarus213(2), 608-624 (2011). • [2] Rodriguez, et al., P., "Impact of aerosols present in Titan's atmosphere on the CASSINI radar experiment," Icarus164(1), 213–227 (2003). • [3] Neish, et al., "Radarclinometry of the sand seas of Africa's Namibia and Saturn's moon Titan," Icarus 208(1), 385-394 (2010). Titan dunes are mainly confined around the equatorial line, between -30° and 30° latitude and covering about 12.5% of the total Titan surface [1] Dunes material: [2] • tholins sand (ε = [2, 2.5] and highly absorptive for the 2.2 cm wavelength signal) • over an icy bed-rock (ε ≈ 3.1, low absorption) Titan dunes height estimation: • Radarclinometry in case of material homogeneity [3]; • Altimeter waveform analysis (in case of material homogeneity). VII RiunioneAnnualeCeTeM-AIT, Bari, 4-5 Dicembre 2012
Dunes backscattering - Fensal T29 Fensal T28 T3 T17 T25 T17 T25 Dunes are visible also in a parallel acquisition with respect to dunes direction • Dunes material is not homogeneous: • Dark stripes: tholinssand (ε≈ 2.2) • Bright stripes: sand-free (or thin layer of tholins sand) interdunes. The icy bedrock is more reflective (ε ≈ 3.1) and less absorptive than sand (volume + sub-layer scattering can exist). VII RiunioneAnnualeCeTeM-AIT, Bari, 4-5 Dicembre 2012
Perpendicular acquisition Samples extracted from T17 and T3: perpendicular acquisition VII RiunioneAnnualeCeTeM-AIT, Bari, 4-5 Dicembre 2012
Hypothesis: homogeneous material dark bright signal What is that angle (i.e tilt angle = 2*slope of the dunes) for which bright and dark samples lie on the same curve? Tilt angle ≈ 30° Slope = 15° is it realistic? VII RiunioneAnnualeCeTeM-AIT, Bari, 4-5 Dicembre 2012
Fit with electromagnetic models GO: ɛ=4.3 ms=4 IEM: ɛ=5 s=0.5cm L=3cm For both GO and IEM the estimated values seem not realistic VII RiunioneAnnualeCeTeM-AIT, Bari, 4-5 Dicembre 2012
Dunes height estimation • Considering an interdune spacing S ranging from 1 to 4 km we obtain mean dunes height H equal to: The estimated dunes result too high! VII RiunioneAnnualeCeTeM-AIT, Bari, 4-5 Dicembre 2012
SAR acquisition over dunes with different observation direction Fly direction SAR dark dark bright bright dark «materialeffect» only dunes dark dark bright bright dark SAR signal «material» + «geometric» effect A A B B VII RiunioneAnnualeCeTeM-AIT, Bari, 4-5 Dicembre 2012
Backscattering angular behavior Only parallel acquisition with respect to dunes direction are considered The off-nadir angle is the same on bothsidesof the dune VII RiunioneAnnualeCeTeM-AIT, Bari, 4-5 Dicembre 2012
Dunes height estimation VII RiunioneAnnualeCeTeM-AIT, Bari, 4-5 Dicembre 2012
(each pixel of the two acquisition correspond to the same area) signal In dB scale (with ) If is known (e.g. linear fit) it is possible to compute . Then 𝒅𝒉 (pixel height) can be computed and thus a Digital Terrain Model (DTM) can be estimated VII RiunioneAnnualeCeTeM-AIT, Bari, 4-5 Dicembre 2012
DTM estimation Parallel acquisition incremental pixel height (dh) pixel slope (α) Perpendicular acquisition integration DTM VII RiunioneAnnualeCeTeM-AIT, Bari, 4-5 Dicembre 2012
Compute single dune height c a b pixel size For each dunes profile compute the dune height for each single dune: VII RiunioneAnnualeCeTeM-AIT, Bari, 4-5 Dicembre 2012
Compute single dune height (example) VII RiunioneAnnualeCeTeM-AIT, Bari, 4-5 Dicembre 2012
Pdf single dunes height mean = 86 m std = 66 m is the value that assures the best fit for the backscattering samples: mean = 117 m std = 90 m mean = 180 m std = 138 m VII RiunioneAnnualeCeTeM-AIT, Bari, 4-5 Dicembre 2012
Conclusions • Titan’s Ontario lakebathymetrymapswereobtainedfrom SAR imagesusingscattering and wavespectummodels and a Bayesianinversionalgorithm • The dependence of depth estimates on the hypotheses on the wind speed alloed to pose realistc constraints on thisparameter • HypothesisofFensalduneshomogeneous in composition and roughnessisnotverified • A simplemodelforseparating the effectsofacquisitiongeometry and surfaceconstituentsissuggestedwherebothparallel and perpendicularSARacquisitions are available on the same area • Altimeter data on the intersection area ofparallel and perpendicular SAR acquisitioncould validate the results and allowtoimprove the dune model VII RiunioneAnnualeCeTeM-AIT, Bari, 4-5 Dicembre 2012