Download
1 / 12
120 likes | 223 Vues
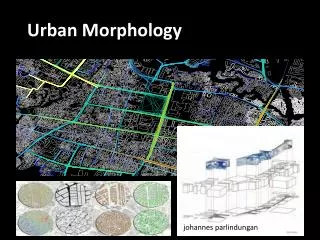
This research project, partially funded with a stimulus grant, aims to conduct urban inventories in 5 states to collect tree data, create jobs, and analyze findings. The timeline includes training crews, quality assurance/control, and data analysis. Approach involves contractors and Cal Poly students using modified data recorders. Data collection includes tree attributes, ground cover, and analysis topics. People skills are vital for urban work.

E N D
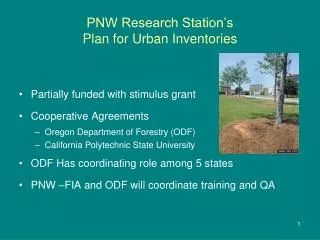
PNW Research Station’sPlan for Urban Inventories • Partially funded with stimulus grant • Cooperative Agreements • Oregon Department of Forestry (ODF) • California Polytechnic State University • ODF Has coordinating role among 5 states • PNW –FIA and ODF will coordinate training and QA
Urban Inventory Objectives • Establish plots on the Base FIA Plot Grid • Collect Baseline Urban Tree Data • Make Data Available To UFOR at Syracuse • Analyze Data Locally and Publish Findings • Create Jobs
Number of Plots by State Urbanized Areas: 2000 U.S. Census definition of 500 people per square mile with census population of at least 50,000: • Alaska 11 + (6 Anchorage, 8 Fairbanks urban clusters) • California 689 • Hawaii 25 + (5 Maui urban clusters) • Oregon 66 • Washington 190
PNW Urban Inventory Timeline 2010 • Train production crews (OR, AK, CA) • Quality assurance/control emphasis • Start California • Start and complete Oregon and Alaska 2011 • Train crews (HI, WA, CA) • Quality assurance/control continues • Crews complete remaining California plots • Crews start and complete Washington • With localarborists complete Hawaii winter 2011
Urban Inventory Approach • Work to be done by contractors, Cal Poly students • ODF and Cal Poly will administer contracts • Urban (only) manual under development (PNW-ODF) • Hand held data recorders—modified ver. of MIDAS
FIA Urban Plot Layout • 4 Subplots: • 24 ft. radius subplots add to 1/6 acre • Center of subplot N1 is GPS referenced • Data obtained for all • trees ≥ 1.0” DBH 2 Subplot: 24.0 ft. radius Azimuth 1-2 = 360º Azimuth 1-3 = 120º Azimuth 1-4 = 240º Distance between Subplot centers is 120.0 ft. horizontal 1 3 4
Subplot Attributes • Subplot: Ground Cover by Type • Percent maintained (mowing, weeding, herbiciding, etc.) • Pct cover by attribute (buildings, • permeable, herbaceous, etc.): • Tree cover • Shrub and seedling cover • Low herbaceous • Building proximity data • (energy)
Tree Attributes • Damage to tree • Urban • Natural • Diseases • Insects • Urban restrictions • Sidewalks • Power lines • Crown condition • Size and shape • Transparency • Density • Dieback • Poor maintenance
Data Analysis Topics • Document dist’n, cover, and health of tree species • Tree crown health and incidence of disease • Incidence of exotics, offsite, or invasive species • Potential hosts for diseases present • Percent ground covered by impervious surfaces
Finally, working in urban areas and obtaining permissions require excellent people skills
RM Research Station’s -FIA supportof New Mexico Inventory • New Mexico received stimulus funding to collect data on P2 plots in 3 out of 10 panels • Additional FIA support role • Pre-field logistics • Measure all P3 plots • QA procedures on P2 plots • Collect 1 additional P2/P3 panel