Download
1 / 1
10 likes | 93 Vues
Investigating the use of squid by-products as a sustainable organic home lawn fertilizer compared to synthetic fertilizers. The study evaluates soil quality, microbial activity, turf visual uniformity, and nutrient content over two years.

E N D
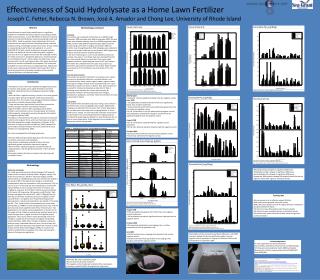
Effectiveness of Squid Hydrolysate as a Home Lawn Fertilizer Joseph C. Fetter, Rebecca N. Brown, José A. Amador and Chong Lee, University of Rhode Island Visual Uniformity Visual Uniformity Extractable NH4(mg/N/kg) Abstract Proper disposal of squid (Loligo pealei) waste is a significant problem for the Rhode Island squid industry. According to Rhode Island squid processors, it costs $65-90/ton to dispose of squid by-products, or nearly $100,000 per squid processing plant each year (USA, 2007). Squid by-products (squid hydrolosate; SH) can be converted into an organic fertilizer, alleviating disposal costs and possibly creating a marketable product from waste. SH was utilized as a liquid and granular fertilizer and applied at 1, 3, and 6 lb/N/1000 ft2/yr. Both a liquid and granular standard synthetic fertilizer was applied at the same rates along with a negative control to serve as a negative control. Soil was evaluated monthly for nitrate, ammonium, phosphate, potassium, microbial activity, and microbial biomass N. Yearly analysis included heavy metal content, total C and N, and organic matter. Pore water was tested monthly for nitrate and biweekly for phosphate. Turf quality was evaluated for visual uniformity, and clipping biomass. Digital color analysis was measured yearly. Results have showed SH in both a liquid and granular form favorably compares to the standard synthetic fertilizers in all analyses tested. Methodology continued Sampling Soil samples were collected monthly from June 2008 through November 2008, and again from May to November 2009. Soil pore water was collected biweekly, from June 2008 through November 2008, and from May 2009 through November 2009. Visual turf quality ratings were taken in August and October 2008 and monthly June through November 2009. Clippings were collected in August and October 2008, and July and October 2009. Digital color analysis was determined in October both years . A soil corer measuring 15 x 1.25 cm was utilized to extract soil samples. The upper 2.5 cm thatch layer was discarded from the four core samples taken from each plot. Cores were mixed together, placed in a plastic bag and stored at 40C until analysis. Pore water was collected from every plot using suction cup lysimeters placed at 60 cm below the soil surface. Water samples were placed in 20 ml scintillation vials and stored at 40C until analysis Soil and water analyses Soil samples are analyzed monthly for soil moisture, pH, nitrate, ammonium, phosphate, potassium, microbial biomass, and microbial activity. Heavy metals, organic matter, organic carbon, and organic nitrogen content of soil are determined once a year. Methods of analysis are shown in Table 1. Pore water samples are analyzed for nitrate and phosphate as described in Table 1. Sampling occurs biweekly for nitrate, and bimonthly for phosphate. Fertilizers will be analyzed for total nitrogen, phosphorous, potassium, and heavy metal concentrations annually as described in Table 1 Turf quality Turf quality will be evaluated using visual ratings. Color analysis is performed once a year using digital color analysis. Additionally, clippings are collected from the center 25m2 of each plot using a 60-cm width push reel mower with a clippings basket. A 30-cm buffer zone is utilized on each side of the collection area to avoid contamination from surrounding treatments. Clippings will are transferred to paper bags and placed in a seed drying room for 14 days at room temperature. Dried clippings are then weighed to determine relative shoot growth. • Introduction • Fertilization of turf is the most important management practice to maintain high quality, and a regular fertilization schedule should be implemented into all management practices (Voigt, 1998). • When fertilizer is applied correctly, it results in an overall greener turf color, higher density and greater uniformity compared to unfertilized turf. This results in less damage to fertilized turfgrass from biotic and abiotic stresses (Voigt, 1998). • There are few home lawn fertilizer studies that compare the benefits of organic fertilizer and synthetic fertilizers. • Organic fertilizers claim to offer advantages that synthetic fertilizers cannot provide, such as increased water and nutrient holding capacity, along with promoting the growth of beneficial soil organisms (Bailey, 2002). • Populations of soil bacteria and fungi are necessary to mineralize nutrients into inorganic forms, which are then taken up by plants. • Microbial populations supply a steady flow of nitrogen to the plant over a longer period of time (McCarty, 2003) compared to quick-release synthetic fertilizers that have a potential to cause fertilizer burn (Spangenberg, 1986). • This study investigated the following hypotheses: • Granular (GSH) and liquid (LSH) application will result in greater soil nitrate, ammonium, and phosphate • Both liquid and pelletized synthetic fertilizer will show significantly greater uniformity of perennial ryegrass • GSH will show a significantly greater microbial biomass N • Clipping biomass will be significantly greater in both synthetic fertilizers • Pore water analysis will show increased nitrate leaching with increased N inputs When letters are absent no significant differences were observed. Bars with common letters denotes no significant differences When letters are absent no significant differences were observed Bars showing different letters indicates significant differences were observed When letters are absent no significant differences were observed. • 2008 October • Quality for LSH was significantly better than the negative control • June 2009 • 3 lb applications showed GSH and ProTurf to be significantly better than all other treatments • At 6 lb, both GSH and ProTurf were significantly greater than the LSH liquid and negative control • At 3 lb, all fertilizers in July out-performed the negative control • 6 lb applications showed SHG, Aquatrol, and ProTurf to be significantly greater than the negative control. • August 2009 • At 3 lb, all fertilizers outperformed the negative control application • At 6 lb, LSH, GSH and Aquatrol outperformed the negative control • October 2009 • At 3lb, LSH, GSH and ProTurf out-performed negative control • 6 lb LSH out-performed the negative control. Extractable PO4(mg/P/kg) Microbial Activity Table 1. Sampling frequency and methods of analysis. Mass of Dried Grass Clippings (g/plot) Bars with common letters denotes no significant differences When letters are absent no significant differences were observed Bars showing different letters indicates significant differences were observed Extractable NO3(mg/N/kg) Methodology Study site and design The study was conducted at the Richard Skogley Turf Research Center on the University of Rhode Island’s Kingston campus. The study area consists of a 185.8-m2 perennial ryegrass (Lolium perenne) plot on a Bridgehampton silt loam soil that was seeded in the spring of 2007. The experimental design is a randomized complete block with four replications. Each plot measures 1.52 m x 1.52 m (2.31 m2). The study site was maintained as a home lawn, mowed weekly at 3.8 cm using a John Deere reel mower, and irrigated as necessary. Four fertilizer treatments were employed: (1) SH-liquid, (2) SH-granular, (3) Aquatrol and (4) ProTurf. Each fertilizer was applied at rates of 455, 1,360, 2,700 g/N/93 m2/yr, with the zero-fertilizer treatment serving as a negative control. Liquid fertilizers are applied more frequently throughout the growing season, and granular applications are applied in the spring and fall. Thus, liquid fertilizers were applied every three weeks starting May 15, 2008 for a total of 8 applications per year, and the granular product was applied a total of four times per year: two applications in the spring, and two applications in the fall. Due to the length of time it takes to break granular products down into a usable nitrogen form, a higher amount of N is applied at each application. This ensures that an evenly-distributed amount of nitrogen is supplied to the turf plants throughout the growing season (Stanhnke, 2005). When nitrogen is applied in excessive amounts many undesirable effects are seen, such as excess leaf growth coupled with decreased root growth and increases in both disease and the thatch layer (Higgins, 1998). To maximize turf health, liquid fertilizers are applied more often, decreasing the amount of nitrogen per application. • Microbial biomass showed no significant differences • Extractable soil NH4 showed no significant differences • Soil extractable PO4 showed no significant differences • September 2008 analysis showed GSH outperformed LSH and the negative control with regard to microbial activity. Pore Water NO3(mg NO3-N/L) • Conclusions • SH was proven to be an effective organic fertilizer • GSH produced the greatest visual turf quality • GSH produced a greater amount of clipping biomass compared to standard synthetic fertilizers • SH did not increase NO3 leaching into the groundwater • SH did not increase microbial biomass or microbial activity • SH exhibited the same soil fertility as both liquid and granular synthetic fertilizers Bars with common letters denote no significant differences. When letters are absent no significant differences were observed. Bars showing different letters indicate significant differences were observed. • August 2008 • G SH was significantly greater than ProTurf and the negative control treatments • LSH and Aquatrol produced significantly more clippings than the negative control • October 2008 • GSH produced significantly more clippings than all other treatments at the 6 lb application rate • July 2009 • 3 lb GSH produced more clippings than Aquatrol, LSH and the negative control. • 6 lb GSH and ProTurf had significantly more clippings than Aquatrol, LSH and the negative control Bars with common letters denotes no significant differences When letters are absent no significant differences were observed Bars showing different letters indicates significant differences were observed • Extractable soil NO3 showed no significant differences until 2009 • Aquatrol applied at 6 lbs was significantly higher than the negative control application in August and October 2009 and for all treatments in September 2009 • Acknowledgements • Funds supplied by Sea Grant Foundation • Janet Atoyan Laboratory of Soil Science and Microbiology • Printing services provided by the RI-INBRE Centralized Research Core Facility supported by Grant # P20RR16457 from NCRR/NIH • Porewater N03 rarely exceeded 10mg/l • NO3 increased as N inputs increased • The negative control treatment resulted in NO3 in porewater, indicating a residual N effect throughout the experiment References USA, S.F. 2007. Narragansett. RI. Voigt, T., Tom Fermanian, and David Wehner. 1998. Turfgrass Fertilization [Online] http://www.lakeswcd.org/documents/Turfgrass%20Fertilization%20in%20Illinois.pdf. Bailey, K. 2002. Organic Fertilizers [Online] http://www.ces.ncsu.edu/cumberland/fertpage/organic.html (posted 2/26/02. ). McCarty, L.B., Ian R. Rodriguez, B. Todd Bunnell, F. Clint Waltz. 2003. Fundamentals of Turfgrass and Agricultural Chemistry John Wiley & Sons, Hoboken. Spangenberg, B.G., T. W. Fermanian, and D. J. Wehner. 1986. Evaluation of Liquid-Applied Nitrogen Fertilizers on Kentucky Bluegrass Turf. Agronomy Journal 78. Stanhnke, G.K., Stanton E. Brauen, Ralph S. Byther, Aarhur L. Antonelli, Gary Chastanger. 2005. Home Lawns, pp. 1-15. Higgins, J.M. 1998. Home Lawn Maintenance.