Protein Networks / Protein Complexes
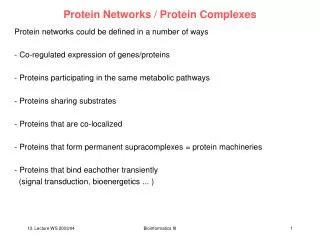
Protein Networks / Protein Complexes. Protein networks could be defined in a number of ways - Co-regulated expression of genes/proteins Proteins participating in the same metabolic pathways Proteins sharing substrates Proteins that are co-localized

Protein Networks / Protein Complexes
E N D
Presentation Transcript
Protein Networks / Protein Complexes • Protein networks could be defined in a number of ways • - Co-regulated expression of genes/proteins • Proteins participating in the same metabolic pathways • Proteins sharing substrates • Proteins that are co-localized • Proteins that form permanent supracomplexes = protein machineries • Proteins that bind eachother transiently • (signal transduction, bioenergetics ... ) Bioinformatics III
A biological cell: a large construction site? In a biological cell there are many tasks that need to be executed in a timely and precise manner. Job office publishes lists (DNA) of people looking for jobs (protein). Managers from the personnel office (DNA-transcription factors) recruit (express) proteins. Workers (proteins) need to get to their working places (localization). During work they get energy from drinking beer (ATP). All steps depend on interaction of proteins with DNA or with other proteins! Bioinformatics III
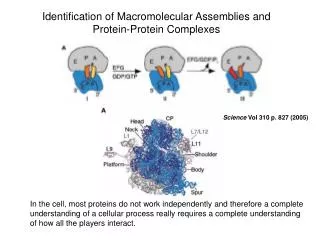
1 Protein-Protein Complexes It has been realized for quite some time that cells don‘t work by random diffusion of proteins, but require a delicate structural organization into large protein complexes. Bioinformatics III
Examples of Stable Protein Complexes: Ribosome The ribosome is a complex subcellular particle composed of protein and RNA. It is the site of protein synthesis, http://www.millerandlevine.com/chapter/12/cryo-em.html Model of a ribosome with a newly manufactured protein (multicolored beads) exiting on the right. Bioinformatics III
Examples of Stable Protein Complexes: Proteasome The proteasome is the central enzyme of non-lysosomal proteindegradation. It is involved in the degradation of misfolded proteins as well as in the degradation and processing of short lived regulatory proteins.The 20S Proteasome degrades completely unfoleded proteins into peptides with a narrow length distribution of 7 to 13 amino acids. http://www.biochem.mpg.de/xray/projects/hubome/images/rpr.gif Löwe, J., Stock, D., Jap, B., Zwickl, P., Baumeister, W. and Huber, R. (1995). Crystal structure of the 20S proteasome from the archaeon T. acidophilum at 3.4 Å resolution. Science268, 533-539. Bioinformatics III
Stable Protein Complex: Nuclear Pore Complex A three-dimensional image of the nuclear pore complex (NPC), revealed by electron microscopy. A-B The NPC in yeast. Figure A shows the NPC seen from the cytoplasm while figure B displays a side view. C-D The NPC in vertebrate (Xenopus). http://www.nobel.se/medicine/educational/dna/a/transport/ncp_em1.html Three-Dimensional Architecture of the Isolated Yeast Nuclear Pore Complex: Functional and Evolutionary Implications, Qing Yang, Michael P. Rout and Christopher W. Akey. Molecular Cell, 1:223-234, 1998 Bioinformatics III
Stable Protein Complex: Photosynthetic Unit • Other large complexes: • - Apoptosome • Thermosome • Transcriptome Structure suggested by force field based molecular docking. http://www.ks.uiuc.edu/Research/vmd/gallery • Other large complexes: • Apoptosome 7-fold symmetry • Chaperone (GroEL/GroES) 7-fold symmetry • Thermosome • Transcriptome Bioinformatics III
2 Protein-protein networks Bioinformatics III
2. Yeast 2-Hybrid Screen Data on protein-protein interactions from Yeast 2-Hybrid Screen. One role of bioinformatics is to sort the data. Bioinformatics III
Protein cluster in yeast Cluster-algorithm generates one large cluster for proteins interacting with each other based on binding data of yeast proteins. Schwikowski, Uetz, Fields, Nature Biotech. 18, 1257 (2001) Bioinformatics III
Annotation of function After functional annotation: connect clusters of interacting proteins. Schwikowski, Uetz, Fields, Nature Biotech. 18, 1257 (2001) Bioinformatics III
Annotation of localization Schwikowski, Uetz, Fields, Nature Biotech. 18, 1257 (2001) Bioinformatics III
Relation between lethality and function as centers in protein networks • study analyzed protein-protein interaction network in yeast S. cerevisae Yeast two-hybrid screen data identified 2240 direct physical interactions between 1870 proteins, see Uetz et al. (1999) und Xenarios et al. (2000). • analyze the effects of single gene deletions for lethality: in proteom data base existed 1572 entries of known phenotypic profiles. Jeong, Mason, Barabási, Oltvai, Nature411, 41 (2001) Bioinformatics III
Protein-Protein interactions in yeast Cluster analysis of 2YHB data. Shown is largest cluster containing 78% of all proteins. The color of each node marks the phenotypic effect if this protein is removed from the cell (gene knockout). red - lethal green – no effect orange – slow growth gelb - unknown Jeong, Mason, Barabási, Oltvai, Nature411, 41 (2001) Bioinformatics III
Relation between lethality and function as centers in protein networks Likehood p(k) of finding proteins in yeast that interact with exactly k other proteins. Probability has power law dependence. (Similar plot for bacteriumHeliobacter pylori.) network of protein-protein interactions is a very inhomogenous scale-free network where a few, highly connected, proteins play central roles of mediating the interactions among other, less strongly connected, proteins. Jeong, Mason, Barabási, Oltvai, Nature411, 41 (2001) Bioinformatics III
Relation between lethality and function as centers in protein networks Computational analysis of the tolerance of protein networks for random errors (gene deletions). Random mutations don’t have an effect on the total topology of the network. When “hub” proteins with many interactions are eliminated, the diameter of the network decreases quickly. The degree of proteins being essential (gene knock-out is lethal for cell) depends on the connectivity in the yeast protein network. Strongly connected proteins with central roles in the architecture of the network are 3 times as essential as proteins with few connections. Jeong, Mason, Barabási, Oltvai, Nature411, 41 (2001) Bioinformatics III
3 Identification of protein complexes Bioinformatics III
Systematic identication of large protein complexes Yeast 2-Hybrid-method can only identify binary complexes. Cellzome company: attach additional protein P to particular protein Pi , P binds to matrix of purification column. yieldsPi and proteins Pk bound to Pi . Identify proteins by mass spectro- metry (MALDI- TOF). Gavin et al. Nature 415, 141 (2002) Bioinformatics III
Analyis of protein complexes in yeast (S. cerevisae) Identify proteins by scanning yeast protein database for protein composed of fragments of suitable mass. Here, the identified proteins are listed according to their localization (a). (b) lists the number of proteins per complex. Gavin et al. Nature 415, 141 (2002) Bioinformatics III
Example of particular complex Check of the method: can the same complex be obtained for different choice of attachment point (tag protein attached to different coponents of complex)? Yes (see gel). Method allows to identify components of complex, not the binding interfaces. Better for identification of interfaces: Yeast 2-hybrid screen (binary interactions). 3D models of complexes are important to develop inhibitors. • theoretical methods (docking) • electron tomography Gavin et al. Nature 415, 141 (2002) Bioinformatics III
3. Netzwerk aus Proteinkomplexen Service function of Bioinformatics: catalog such data and prepare for analysis ... allowing to formulate new models and concepts (biology!). If results are very important don‘t wait for some biologist to interpret your data. You may want to get the credit yourself. Modularity = Formation of separated Islands ?? Gavin et al. Nature 415, 141 (2002) Bioinformatics III
Structural ProteomicsSali, Glaeser, Earnest, Baumeister, Nature 422, 216 (2003) Biological cells are not organized by undirected diffusion of the soluble proteins! Instead many important cellular functions are carried out by stable or transiently formed protein complexes. Bioinformatics III
known protein structures PDZ Domäne CheA Aquaporin Ribosom Large proteins are underrepresented in the PDB data base. Based on the Cellzome results, people estimate that each protein complex in yeast contains 7.5 proteins. Sali et al. Nature 422, 216 (2003) Bioinformatics III
Single particle analysis with EM • Complexes of 44 tripeptidyl-peptidase II molecules on a surface. • The pictures in each line show different averaged views of complexes possessing • the same orientation image analysis. • (b) 3D-rekonstruction of the TPP II-complex at 3.3 nm resolution. • Different views. Note the enhanced resolution by combining information of • the different views shown in (a). Sali et al. Nature 422, 216 (2003) Bioinformatics III
Information about macromolecular complexes ‚Subunit structure‘ : atomic resolution < 3 Å ‘Subunit shape’ : medium resolution > 3 Å ‘Subunit contact’: Knowledge about direct spatial contacts between subunits ‘Subunit proximity’: subunits don’t need to be in direct contact. Grey boxes indicate areas with large experimental difficulties. Sali et al. Nature 422, 216 (2003) Bioinformatics III
Hybrid-methods for macromolecular complexes Structural Bioinformatics (a) Integration of varios protein elements into one large complex. (b) Partial atomic model of the entire yeast ribosome by fitting atomic models of rRNA and proteins into a low-resolution EM map of the 80S ribosome. Sali et al. Nature 422, 216 (2003) Bioinformatics III
Structure of large complexes: combine EM + X-ray docking of atomic X-ray structure of tubulin (3.5 Å resolution) into 8Å-EM-structure of microtubuli. Sali et al. Nature 422, 216 (2003) Bioinformatics III
Situs package: Automated low-resolution fitting Situs was developed for automatic fitting of high-resolution structures from X-ray crystallography into low-resolution maps from electron microscopy. http://biomachina.org see also database for animations of EM data: http://emotion.biomachina.org/ Idea: Create low-resolution image of X-ray structure. Determine center of mass and moments of inertia. Model one protein by a few mass centers. Use neuronal network to best position nodes (mass points) into EM density map of the molecular complex. Molecular mass represented by nodes should maximally overlap with EM map. Wriggers et al. J. Mol. Biol. 284, 1247 (1998) Bioinformatics III
Discretization of proteins by few mass points Wriggers et al. J. Mol. Biol. 284, 1247 (1998) Bioinformatics III
Reconstruction of actin filament using Situs Wriggers et al. J. Mol. Biol. 284, 1247 (1998) Bioinformatics III
Reconstruction of actin filament using Situs Wriggers et al. J. Mol. Biol. 284, 1247 (1998) Bioinformatics III
Situs package: Conformational Dynamics In the mean time, the Situs developers have also switched to using FFT techniques to match images and real data. Chacon et al. Acta Cryst D 59, 1371 (2003) Bioinformatics III
Electron Tomography a) The electron beam of the EM microscope is scattered by the central object and the scattered electrons are detected on the black plate. By tilting the object in small steps, we collect electrons scattered at different angles. b) reconstruction in the computer. Back-projection (Fourier method) of the scatter-information at different angles. The superposition generates a three-dimensional tomogrom. Sali et al. Nature 422, 216 (2003) Bioinformatics III
Identification of macromolecular complexes in cryoelectron tomograms of phantom cells Prepare „phantom cells“ (ca. 400 nm diameter) with well-defined contents: Liposomes filled with thermosomes and 20S proteasomes. Thermosome: 933 kD, 16 nm diameter, 15 nm height, subunits assemble into toroidal structure with 8-fold symmetry. 20S proteasome: 721 kD, 11.5 nm diameter, 15 nm height, subunits assemble into toroidal structure with 7-fold symmetry. Collect Cryo-EM pictures of phantom cells for a tilt series from -70º until +70º with 1.5º increments. Aim: identify and map the 2 types of proteins in the phantom cell. This is a problem of matching a template, ideally derived from a high-resolution structure, to an image feature, the target structure. Frangakis et al., PNAS 99, 14153 (2002) Bioinformatics III
Detection and idenfication strategy Frangakis et al., PNAS 99, 14153 (2002) Bioinformatics III
Search strategy • Adjust pixel size of templates to the pixel size of the EM 3D reconstruction. • The gray value of a voxel (volume element) containing ca. 30 atoms is obtained by summation of the atomic number of all atoms positioned in it. • Possible search strategies: • Scan reconstructed volume by using small boxes of the size of the target structure (real space method) • Paste template into a box of the size of the reconstructed volume (Fourier space method). This method is much more efficient. Frangakis et al., PNAS 99, 14153 (2002) Bioinformatics III
Correlation with Nonlinear Weighting The correlation coefficient CC is a measure of similarity of two features e.g. a signal x (image)and a template r both with the same size R. Expressed in one dimension: are the mean values of the subimage and the template. The denominators are the variances To derive the local-normalized cross correlation function or, equivalently, the correlation coefficients in a defined region R around each voxel k, which belongs to a large volume N (whereby N >> R), nonlinear filtering has to be applied. This filtering is done in the form of nonlinear weighting. Frangakis et al., PNAS 99, 14153 (2002) Bioinformatics III
Raw data • Central x-y slices through the 3D reconstructions of ice-embedded phantom cells filled with • 20S proteasomes, • thermosomes, • and a mixture of both particles. • At low magnification, the macromolecules appear as small dots. Frangakis et al., PNAS 99, 14153 (2002) Bioinformatics III
Correlation coefficients • Histogram of the correlation coefficients of the particles found in the proteasome-containing phantom cell scanned with the "correct" proteasome and the "false" thermosome template. Of the 104 detected particles, 100 were identified correctly. The most probable correlation coefficient is 0.21 for the proteasome template and 0.12 for the thermosome template. • Histogram of the correlation coefficients of the particles found in the thermosome-containing phantom cell. Of the 88 detected particles, 77 were identified correctly. The most probable correlation value is 0.21 for the thermosome template and 0.16 for the proteasome template. • Detection in (a) works well, but is somehow problematic in (b) because (correct) thermosome and proteasome are not well separated. Frangakis et al., PNAS 99, 14153 (2002) Bioinformatics III
Reconstruction of phantom cell Volume-rendered representation of a reconstructed ice-embedded phantom cell containing a mixture of thermosomes and 20S proteasomes. After applying the template-matching algorithm, the protein species were identified according to the maximal correlation coefficient. The molecules are represented by their averages; thermosomes are shown in blue, the 20S proteasomes in yellow. The phantom cell contained a 1:1 ratio of both proteins. The algorithm identifies 52% as thermosomes and 48% as 20S proteasomes. Frangakis et al., PNAS 99, 14153 (2002) Bioinformatics III
Electron tomography • Method has very high computational cost. • Observation: biological cells are not packed so densely as expected, allowing the identification of single proteins and protein complexes • Problem for real cells: molecular crowding. • Potential difficulties to identify spots. • - need to increase spatial resolution of tomograms Frangakis et al., PNAS 99, 14153 (2002) Bioinformatics III
Reconstruction of endoplasmatic reticulum Picture rights shows rough endoplasmatic reticulum (membrane network in eukaryotic cells that generates proteins and new membranes) coated with ribosomes. The picture is taken from an intact cell. Membranes are shown in blue, the ribosomes in green-yellow. http://science.orf.at/science/news/61666 Dept. of Structural Biology, Martinsried Bioinformatics III
Reconstruction of actin filaments Actin filaments are structural proteins – they form filaments which span the entire cell. They stabilize the cellular shape, are required for motion, and are involved in important cellular transport processes (molecular motors like kinesin walk along these filaments). Shown is the cytoskeleton of Dictyostelium. Apparently, filaments cross and bridge each other at different angles, and are connected to the cell membrane (right picture). Actin filaments are shown in brown. The cell segment left has a size of 815 x 870 x 97 nm3. Middle: single actin filaments connected at different angles. Right: actin filaments (brown) binding to the cell membrane (blue). http://science.orf.at/science/news/61666 Dept. of Structural Biology, Martinsried Bioinformatics III
Science fiction • Reconstruct proteom of real biological cells. • Required steps: • obtain EM maps of isolated (e.g. 6000 yeast) proteins • enhance resolution of tomography • speed up detection algorithm http://science.orf.at/science/news/61666 Dept. of Structural Biology, Martinsried Bioinformatics III
Summary • The structural characterization of large multi-protein complexes and the resolution of cellular architectures will likely be achieved by a combination of methods in structural biology: • X-ray crystallography and NMR for high-resolution structures of single proteins and pieces of protein complexes • (Cryo) Electron Microscopy to determine medium-resolution structures of entire protein complexes • Stained EM for still pictures at medium-resolution of cellular organells • (Cryo) Electron Tomography to for 3-dimensional reconstructions of biological cells and for identification of the individual components. • Mapping and idenfication steps require heavy computation. • Employ protein-protein docking as a help to identify complexes? Botstein & Risch, Nature Gen. 33, 228 (2003) Bioinformatics III