Download
1 / 53
570 likes | 1.51k Vues
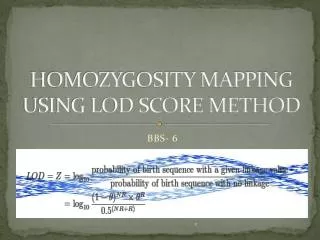
HOMOZYGOSITY MAPPING USING LOD SCORE METHOD. BBS- 6. CONTENTS. INTRODUCTION METHODS OF HOMOZYGOSITY MAPPING HOMOZYGOSITY MAPPER GENETIC LINKAGE LOD SCORE METHOD. LET US START WITH THE BASICS!. KEY TERMS. HOMOZYGOSITY. Containing two identical allelic forms Can be homozygous dominant

E N D
CONTENTS • INTRODUCTION • METHODS OF HOMOZYGOSITY MAPPING • HOMOZYGOSITY MAPPER • GENETIC LINKAGE • LOD SCORE METHOD
HOMOZYGOSITY • Containing two identical allelic forms • Can be homozygous dominant • Can be homozygous recessive • PEA PLANT
HETEROZYGOUS • BOTH ALLELES OF A GENE ARE DIFFERENT • ONE GENE IS DOMINANT • ONE GENE IS RECESSIVE
GENETIC MAPPING • SETTING A LOCATION WITH RESPECT TO A MARKER • PLOTTING DNA FRAGMENTS ON CHROMOSOMES • HELPFUL IN PREDICTING A DISEASE
GENETIC MARKER • A GENE OR A DNA SEQUENCE FOR A PARTICULAR TRAIT • HAS A PARTICULAR LOCATION ON A CHROMOSOME • DETECTION HELPFUL IN PREDICTING A DISEASE
RECOMBINATION • BREAKING AND REJOINING OF DNA MOLECULES • EXAMPLE IS CROSSING OVER • EXCHANGE OF GENETIC MATERIAL TAKES PLACE • RESULTING MOLECULES ARE CALLED RECOMBINANTS
RECOMBINATION FREQUENCY • TOTAL NUMBER OF RECOMBINANTS/TOTAL NUMBER OF PROGENIES IN A TEST CROSS • USED TO DETERMINE THE GENETIC DISTANCE • CREATION OF GENETIC MAP • CENTIMORGAN
HOMOZYGOSITY MAPPING • METHOD USED TO DETECT THE DISEASE OF THE HOMOZYGOUS CONDITION • HELPFUL FOR THE INHERITED DISORDERS
THREE MAIN METHODS • SNP MICROARRAYS • RFLP • MICROSATELLITE MARKERS
1. SNP MICROARRAYS • STANDS FOR SINGLE NUCLEOTIDE POLYMORPHISM • INVOLVES A SINGLE PCR METHOD FOLLOWED BY GEL ELECTROPHORESIS • TETRA-PRIMER ARMS PCR
APPLICATIONS • HIGH DENSITY SNP ARRAYS FOR GENOTYPING • MUTATION IDENTIFICATION BY POSITIONAL CLONING
BARDET BEIDL SYNDROME • ABBREVIATED AS BBS • CHARACTERIZED BY: OBESITY; PIGMENTARY RETINOPATHY; POLYDACTYLY; HYPOGONADISM • RENAL AND CARDIAC ABNORMALITES • COGNITIVE IMPAIRMENT
2. RFLP • STANDS FOR RESTRICTION FRAGMENT LENGTH POLYMORPHISM • USED TO FOLLOW THE PATH OF A SPECIFIC GENE • VARIATIONS IN THE HOMOLOGOUS DNA SAMPLES
METHOD • CUTTING DNA SAMPLES WITH RESTRICTION ENZYMES • SEPERATION BY AGAROSE GEL ELECTROPHORESIS • DETERMINING THE NUMBER OF FRAGMENTS AND SIZES
APPLICATIONS • DNA FINGERPRINTING • TRACING ANCESTORY • STUDYING EVOLUTION AND MIGRATION • DETECTION AND DIAGNOSIS • GENETIC MAPPING
HOMOZYGOSITY MAPPER: • Web based approach for homozygosity mapping. • Stores markers data in its database…users can upload their SNP files there. • Data analysis is quick, detects homozygous alleles, and represents graphically. • Zooming in and out of a chromosome. • Access: • Restricted • Public • Integrated with GeneDistiller engine
Microsatellite Markers: • SSTRs • VSTMs • Acting as markers • Di, tri, tetra, penta nucleotides • Present on non-coding sequences • Amplified by locus specific primers with PCR • Example: • Presence of AC (n) in birds where n varies from 8 to 50.
Uses: • Important most tool in mapping genome • Serve in biomedical diagnosis as markers for certain disease conditions • Primary marker for DNA testing in forensics for high specificity. • Markers for parentage analysis • address questions concerning degree of relatedness of individuals or groups
Pedigree • Lineage or Genealogical study of family lines. • Gives list or family tree of ancestors. • Used for studies of certain inheritance pattern.
Genetic Linkage: • Staying together of physically close loci. • Offspring acquires more parental combinations. • Discovery: • An Exception to “Mendel's Law of independent Assortment” • Thomas Morgan : Linked genes are physical objects, linked in close proximity
Genetic Linkage • Morgan’s Experiments: • 1st Cross: • F1 Progeny: • Heterozygous red eyed males and females • 2nd Cross: • F2 Progeny: • 2,459 red-eyed females • 1,011 red-eyed males • 782 white-eyed males
Sex limited trait…evidence • Crossed: • White eyed males (original) X F1 daughters… • 129 red-eyed females • 132 red-eyed males • 88 white-eyed females • 86 white-eyed males • Conclusions: • Eye color is Sex Linked…. • Physically closer genes do not assort independently
LINKAGE MAP • Genetic Map for location determination of genes and genetic markers. • Based on markers recombination frequency during cross over. • Predicts the relative position, not the physical distance between genes. • separated • Lesser the distance, more tightly they are bound, more often inherited together. • Centi Morgan: unit to calculate linkage distance • One centimorgan corresponds to about 1 million base pairs in humans. • Two markers on a chromosome are one centimorgan apart if they have a 1% chance of being
Constructing Linkage Map: • Based on frequency of genetic markers passing together.
LOD Score Method • Developed by Newton E. Morton • LOD:Logarithm (base 10) Of Odds • A statistical test for linkage analysis in • Human • Animal • Plant populations • It checks whether the two loci are: • Indeed linked or • They occur together by chance • Usually done to check linkage of symptoms in syndromes
LOD Score Method • The Method: • Establish a pedigree • Make a number of estimates of recombination frequency • Calculate a LOD score for each estimate • The estimate with the highest LOD score will be considered the best estimate
Calculations: Where: • NR denotes the number of non-recombinant offspring • R denotes the number of recombinant offspring • Theta is the recombinant fraction, it is equal to R / (NR + R) • 0.5 in the denominator means that alleles that are completely unlinked have a 50% chance of recombination
LOD score Result • LOD score can be either positive or negative • Positive LOD score means Linkage present • Negative LOD score means No Linkage • >3 Evidence for linkage • +3 1000 to 1 odds that the linkage did not occur by chance • <-2 Evidence to exclude linkage
Mapping Genes with LOD Score Method • Determines R (Recombination Fraction, fraction of gametes that are recombinant) using data from small families • R value varies from 0 – 0.5 • 0 2 completely linked genes • 0.5 2 completely unlinked genes
Steps Involved • Determine the expected frequencies of F2 phenotypes • Determine the likelihood that the family data observed resulted form given R value • Determine LOD ratio • Add LOD scores from different families to achieve a high LOD score so a most likely R value can be assigned
EXAMPLE • We are using two COMPLETELY DOMINANT GENES • Heterozygote is indistinguishable from dominant homozygote • Two genes are • A: with A and a alleles • B: with B and b alleles
AB ab P1: AABB X aabb Gametes F1 AaBb Parental Combinations Recombinants AB Ab aB ab
STEP I: Calculate the expected frequency of offspring for values of R from 0-0.5 • Determine the frequency of each gamete produced by F1 generation • For example if R=0.20, then 20% of the gametes produced will be recombinants which in our example are Ab and aB. • As there are 2 types of recombinant gametes, frequency of each type will be 0.10 • 80% gametes are parental, [AB and ab type] frequency of each of them is 0.40 or 40%
Determine the phenotype of each cell in Punnet square • Add up the frequencies to get the total frequency of each offspring phenotype
STEP II: Examine the observed Family Data in light of expected distribution of offspring for each R value • Done by determining the likelihood (L) • Likelihood: • the probability of the observed family • determined using the multinomial theorem • an extension of the binomial theorem.
First define the terms for the observed family • a = number of A_ B_ offspring • b = number of A_ bb offspring • c = number of aaB_ offspring • d = number of aabb offspring • n = total offspring (= a+b+c+d) • Define the terms for the expected family proportions • p = expected proportion of A_B_ offspring • q = expected proportion of A_ bb offspring • r = expected proportion of aaB_ offspring • s = expected proportion of aabb offspring
Multinomial Theorem • Multinomial theorem describing actual family: paqbrcsdmultiplied by a coefficientn! /(a! b! c! d!) • Thus the likelihood equation is
We have calculated phenotypic proportions for R = 0.20 (20 map units between A and B) • A family of 5 children has • 2 children with A_B_ phenotype • 1 with aaB_ • And 2 with aabb
Hence Likelihood is: • Likelihood needs to be calculated between each value of R i.e. 0.01 – 0.5.