Download
1 / 1
10 likes | 162 Vues
Design and Operation of a Remote Phosphorous Analyzer.

E N D
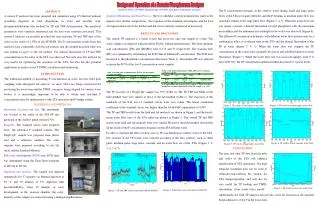
Design and Operation of a Remote Phosphorous Analyzer The P concentration dynamic in the outflow water during small and large pulse flows at the STA were quite different, and the P dynamic at medium pulse flow was somewhat similar to the large pulse flow (Figure 3, 4, 5). When the water flow rate was nearly constant, a diurnal fluctuation of total phosphorus with the maximum near midday and the minimum near midnight in the water was observed (Figure 6). The different P concentration dynamics with different water flow patterns may be a combination effect of residence time in the STA and the diurnal fluctuation of the TP in water (Figure 3, 4, 5). When the water flow was stopped, the TP concentration in the canal water gradually decreased and exhibited almost no daily fluctuation (Figure 7). When the water flow rate was increased quickly from 0 to near 2100 ft3/s, the TP concentration spiked and then decreased to typical levels. David M. Struve, SFWMD, Meifang Zhou, SFWMD, Tom Baber, Litkenhaus Associates ABSTRACT A remote P analyzer has been designed and optimized using UV/thermal induced persulfate digestion of total phosphorus in water and ascorbic acid-phosphomolybdenum blue method for TP and TRP determination. The analytical parameters were remotely monitored and the data were remotely processed. This remote P analyzer successfully provided the near real-time TP and TRP data of the water at the outlet of a STA of the SFWMD. The P concentration results from this analyzer were comparable with the lab analysis and the method detection limit was also similar (4 g/L) to the lab method. The diurnal fluctuation of TP and TRP concentrations in the water at the STA was observed. Not only may this analyzer be very useful for optimizing the operation of the STA, but also has the potential application in surface water P TMDL calculation and monitoring. Analyzer Monitoring and Data Process: The test scheduler, analytical parameters (such as the digestor and cabinet temperatures, the responses of the standards and samples, and the level of reagents and waste in the bottles) and data were remotely monitored or processed. RESULTS AND DISCUSSION The remote TP analyzer is a batch system that processes only one sample at a time. The water sample was digested with persulfate /H2SO4 without neutralization. The final optimum acid concentration ([H]) and [H]/[Mo] were 0.4 N and 75 respectively. The reaction time (RT) was optimized by determining the FCD time at different P concentration. The FCD time increased as the phosphorus concentration decreased (Table 1). Ten minutes RT was selected to insure the FCD of the low P concentration water samples. INTRODUCTION The traditional method of measuring P concentration in water involves field grab sampling with subsequent lab analysis. As more STA’s are being constructed for protecting the ecosystem and the TMDL concept is being adopted for various water bodies, it is increasingly important to be able to obtain near real-time P concentration data for optimization of the STA operation and P budget studies. MATERIALS AND METHODS The TP recovery of a 60 ppb QC sample was 95% (Table 2). The TP, TRP and MDL of the field method were very similar to those of the lab method (Table 2). The responses of the standards of the 642 sets of standard curves were very stable. The linear correlation coefficient of the standard curves was higher than the lab QA/QC requirement of 0.995. The TP and TRP results from the field and lab methods are shown in Figure 1 and the hourly mean water flow rates of the STA outlet are plotted in Figure 2. The overall TP and TRP results from field and lab methods were very similar. However, the field method showed the all the detail of the P concentration dynamics in the STA effluent water. In order to examine the effect of flow rate on TP concentration in outflow water of the STA, five sections of the TP results were selected according to the flow patterns, such as small pulse, medium pulse, large pulse, constant, and no water flow out of the STA (Figure 1, 2, 3, 4, 5, 6, 7). Figure 3. TP results at small pulse water flow Figure 4. TP results at medium pulse water flow Instrument Location and Site: The instrument was located at the outlet of the STA1W just upstream of the outflow pump station G310. Reagents: The standard curves were prepared from the reference P standard solution. The 60ppb QC sample was prepared from phytic acid and a reference standard. The color reagents were prepared according to our lab study and the Standard Method. Full color development (FCD) time: FCD time was determined using the Time Drive program at 880 nm in the lab. Figure 6. TP results at near constant water flow Figure 5. TP results at large pulse water flow CONCLUSION The near real time TP data from the inlet and outlet of the STA will enhance optimization of STA operations. The high temporalresolution data can be used to refine/develop/calibrate the models for STA design/operation, and will also be very useful for TP loading and TMDL calculations from storm water runoff. Digestion and analysis: The sample was digested sequentially for 37 minutes via thermal digestion at 90 C and 30 minutes of UV digestion with persulfate/H2SO4. After 10 minutes of color development in the reaction chamber, the color Figure 7. TP results at near zero water flow Figure 2. Water flow rate at the outlet of STA1W Figure 1. TP and TRP results from field and lab method Additionally, the field TP analyzer can provide a tool for research on the dynamic biogeochemistry of the P in the ecosystem. intensity of the sample was measured using a minispectrophotometer.