Download
1 / 1
10 likes | 109 Vues
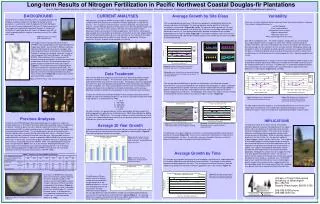
Explore the long-term effects of nitrogen fertilization on Douglas-fir plantations in the Pacific Northwest. This study analyzes volume growth responses over 20 years, considering site variability and fertilization levels. Factors influencing growth variations are examined, such as tree size distribution, species composition, soil conditions, and pests. The research, conducted by the University of Washington and Oak Ridge National Laboratory, provides valuable insights for forest managers aiming to enhance productivity in nitrogen-limited ecosystems.

E N D
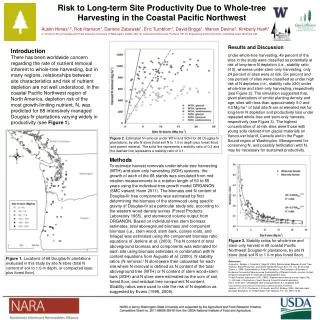
Volume growth (ft3/ac) Volume growth (ft3/ac) Volume growth (ft3/ac) Volume growth (ft3/ac) Volume growth (ft3/ac) Long-term Results of Nitrogen Fertilization in Pacific Northwest Coastal Douglas-fir Plantations Amy R. Sidell, Robert B. Harrison, University of Washington; David G. Briggs, Randol Collier, Robert Gonyea, Stand Management Cooperative; and Robert J. Luxmoore, Environmental Sciences Division, Oak Ridge National Laboratory BACKGROUND CURRENT ANALYSES Average Growth by Site Class Variability Growth of trees in Pacific Northwest forests is typically thought to be limited by available nitrogen (N). Nitrogen fertilization of forest plantations is a common practice throughout the Pacific Northwest, with the aim of increasing productivity of these N limited ecosystems. The response of second and third-growth Douglas-fir stands to N fertilization is typically positive with reports of approximately 60% of stands responding with an increase in volume of at least 10% (Miller et al, 1986). After 20 years, the original RFNRP and other SMC installations have undergone a number of different treatments with multiple N fertilizer applications at varying time intervals. This variation in treatment regime severely complicates meaningful data analysis using the methods previously employed to summarize the growth response of RFNRP plots. Therefore, in this analysis, the data are summarized as growth differences relative to cumulative N fertilizer application. While there is some growth data available over time periods up to 26 years, the number of sites with regular growth data falls off dramatically above 20 years of growth data as the majority of the stands monitored had reached harvestable size after 20 years of monitoring. Therefore, summaries 20 years of growth are presented in this poster. • There are a number of different factors which contribute to the wide variation in response. These factors include differences in: • Initial stocking • Tree size distribution • Competitive status of trees • Species composition • Microsite and or soil • Physical damage, disease, insects • both within and between sites. The effect of species composition was minimized by focussing on growth trends in Douglas-fir stands only. Stands suffering significant numbers tree deaths were also excluded from the analysis to minimize the influence of physical damage, disease and pests on the summary statistics. Although by expressing the growth in terms of an absolute or relative growth increment over a given time period, the focus is shifted to the growth rate over a given time period, the effect of initial stand size differences is not eliminated as the volume added to a tree is typically proportional to its size. The average absolute growth over a 20 year time period was calculated for different site classes and levels of fertilization. The average absolute volume growth for unthinned installations is presented in Figures 8a and 8b. The absolute volume growth over 20 years increased with increasing levels of N fertilizer for all site classes; the largest difference was observed in site class V. No significant differences between fertilization levels could be detected due to the high variability (Figure 8b). There were no obvious trends in the 20 year growth of thinned stands due to high variability and the small number of sites which were both thinned and fertilized. Figure 1: Douglas-fir stand at SMC Installation 134 The Regional Forest Nutrition Research Project (RFNRP), now incorporated into the Stand Management Cooperative (SMC), was formed in 1969 with a primary objective of providing forest resource managers with accurate growth data on fertilization of second growth Douglas-fir and western hemlock stands on a range of sites throughout the Pacific Northwest. As part of the RFNRP, 348 installations (225 unthinned and 123 thinned) receiving varying levels of N fertilizer have been established in 5 phases and monitored regularly for growth response to different N fertilization regimes (Figure 2). These data have been compiled and are currently maintained in a database by the SMC. The SMC database contains plot treatment regimes (Figure 3a) and summaries of all data collected during each measurement event (Figure 3b) for each measurement plot at each SMC installation. Volume (ft3/ac) Site Index I: >140ft II: 120-140ft III: 100-120 ft IV: 80-100 ft V: <80 ft The effect of initial differences in stand size on the representation of growth response can also be diminished by adjusting the difference in treated and untreated stand size by the pre-treatment difference in stand size. The differences in stand volume between treated and untreated plots at each installation were calculated and also adjusted for initial differences in stand volume (Figures 11a and 11b). Figure 8a (above): Average 20 Year Volume Growth by Site Class for Unthinned Stands Figure 5a: Fertilizer Application Figure 5b: Harvesting at SMC Installation 17 Data Treatment Figure 8b (right): Variability associated with Average 20 Year Volume Growth. Average volume growth ± 1 standard deviation Plot summary data from Douglas-fir stands which have been fertilized with nitrogen only were selected for analysis. The cumulative amount of N fertilizer applied was determined for each measurement event at a plot. The absolute stand size and growth increment for a given time period were calculated for each treated and untreated plot. For each installation, the stand size and growth increments for the treated plots were compared to those for the installation’s untreated (control) plot, and the average differences between treated and untreated plots at each installation were calculated. Figure 2: RFNRP Fertilizer Trials; unthinned (•) and thinned (o) stands The average absolute difference in growth was calculated as the difference in growth increment over a 20 year period between the fertilized and control plots at a given installation. The average difference in growth increment can be considered to be the average additional growth caused by N fertilization, and tended to increase with increasing levels of total N fertilizer application over 20 years. Fertilized plots at less fertile sites (lower site class) tended to exhibit greater volume response than those of higher site class (Figure 9a). Volume (ft3/ac) Volume (ft3/ac) Site Index I: >140ft II: 120-140ft III: 100-120 ft IV: 80-100 ft V: <80 ft Site Index I: >140ft II: 120-140ft III: 100-120 ft IV: 80-100 ft V: <80 ft The data for thinned and unthinned installations were analyzed separately and also divided into each of the following Douglas-fir site classes, based on average tree height at age 50 years, as defined by King (1966): I : >140 ft II : 120-140 ft III : 100-120 ft IV: 80-100 ft V : < 80 ft For each site class, the growth data was further separated by the total amount of N fertilizer applied to the plot into five fertilization levels: 200 lb N/ac, 400 lb N/ac, 600 lb N/ac, 800 lb N/ac, 1000 lb N/ac. The average response for each fertilization level and site class was calculated and expressed in terms of absolute stand size and growth of fertilized trees relative to the control. Figure 11b: Difference in Fertilized and Untreated Unthinned Stand Volume Adjusted by Initial Stand Differences Figure 11a: Difference in Fertilized and Untreated Unthinned Stand Volume By adjusting the treatment response, as conveyed by difference in stand size, by the initial stand size difference, the variability was lowered, bringing most average treatment response values into the positive, and lowering the peak response values. Figure 3a: Fertilizer application Figure 3b: SMC stand measurement event Volume Growth (ft3/ac) VolumeGrowth (%) Previous Analyses IMPLICATIONS Summaries of the RFNRP growth data reporting Douglas-fir response to single and multiple applications of N fertilizer have been published periodically since the inception of the project. Growth response has been typically expressed in terms of the periodic annual increment (PAI) in volume and basal area, the difference between the growth rates of treated and untreated stands. The untreated growth rate was estimated for each treatment plot based on a model relating untreated growth rate as a function of breast height age, site index, initial basal area and stems per acre. The initial data analyses reported that 80% of Douglas-fir stands responded to 200 or 400 lb N/ac with an increase of least 10% in basal area, and that the response tended to increase in magnitude and consistency as site quality decreased. (RFNRP, 1974). The reported growth response values are presented in Table 1 for 4, 6, 8 and 10 years following N fertilization. The growth response to N fertilization was reported to peak during the 3rd or 4th growing season following application of 200 lb N/ac (RFNRP, 1978) but was still statistically significant at 10 years for basal area increment. (RFNRP, 1980). Figure 9b: Average Difference in Unthinned Volume Growth Relative to Control (Fertilized -Control)/Control Figure 9a: Average Absolute Difference in Unthinned Volume Growth (Fertilized -Control) Average 20 Year Growth The long-term future of the forest industry in the Pacific Northwest depends in part on the productivity of the region's forests and on the choice of silviculturally sound and cost-effective management regimes. The results of this analysis indicate a trend toward increasing growth increment with increasing rates of fertilization. While the absolute volume is greatest on the most fertile sites, the greatest additional response appears to be in the less fertile sites. The response of unthinned Douglas-fir to N fertilization tends to increase with increasing total levels of N fertilizer application, with no indication of the growth rate leveling off as more fertilizer is added. This suggests that greater growth yields may be possible with even higher levels of cumulative N fertilizer application. Although this analysis found no apparent trends in 20 year growth of thinned sites, there is no reason to believe that the response of thinned sites to fertilization would not follow the same trends as unthinned sites. Past RFNP reports have stated that thinned sites have exhibited higher growth response than unthinned sites, suggesting that the average growth yields for thinned and fertilized sites could be even greater than those reported fertilized unthinned sites. In general, the absolute volume increment over 20 years increased significantly (=0.1) with increasing levels of cumulative N fertilizer applied for unthinned plots (Figure 6). There was no apparent trend for thinned plots. The differences in response between site classes is more pronounced when expressed as a percent of the control (Figure 9b). These results emphasize the difference in response to N fertilization based on site class. As with other measures of growth, there was no distinct pattern of fertilizer response among thinned and fertilized sites. Figure 6 (left): Average Volume Growth over 20 Years. Average value inside bars, standard deviation above error bars 2016 2251 1985 1853 1347 1542 1522 1542 1446 1740 1971 1523 Average Growth by Time Figure 7 (below): Average Difference in 20-Year Growth (Fertilized-Control) The average annual growth increments for unthinned plots receiving only a single application of N fertilizer (200 lb N/ac and 400 lb N/ac) were calculated. The average annual volume increment tended to decrease over time. The average annual volume increment declined slightly more quickly with the lower N fertilizer application rate as presented in Figure 10. Figure 10: Average Annual Volume Increment for Unthinned Stands by Time Since N Fertilizer Application An analysis of RFNRP data along with data from the British Columbia Ministry of Forests reported that 60% of DF stands in western Washington, western Oregon, and western British Columbia responded to N fertilization (Figure 4) and pure Douglas-fir stands responded better than mixed Douglas-fir – western hemlock stands. N fertilization was also reported to accelerate losses of smaller trees in unthinned stands (Miller et al, 1986). The difference in 20 year growth increment between treated and untreated plots can be thought of as the additional growth as a result of N fertilization over the 20 year period. For both unthinned and thinned plots, Average Annual Volume Increment (ft3/ac/yr) the average difference in growth between treated and untreated growth tended to increase with increasing levels of total N fertilizer applied (Figure 7). The average differences in growth among thinned stands was slightly greater than in unthinned stands although the differences were not significant (=0.1). Figure 4: Example of Douglas-fir growth response to N fertilization